Menu
Stuff by Yuki
  • Home
  • Python
  • Power BI
  • Tableau
  • Community
    • Makeover Monday
    • Workout Wednesday
  • About
  • Contact
Stuff by Yuki

Hexagon Tile Map in Tableau

Posted on May 31, 2021June 14, 2021

MoM 2020 Week40 – Tableau

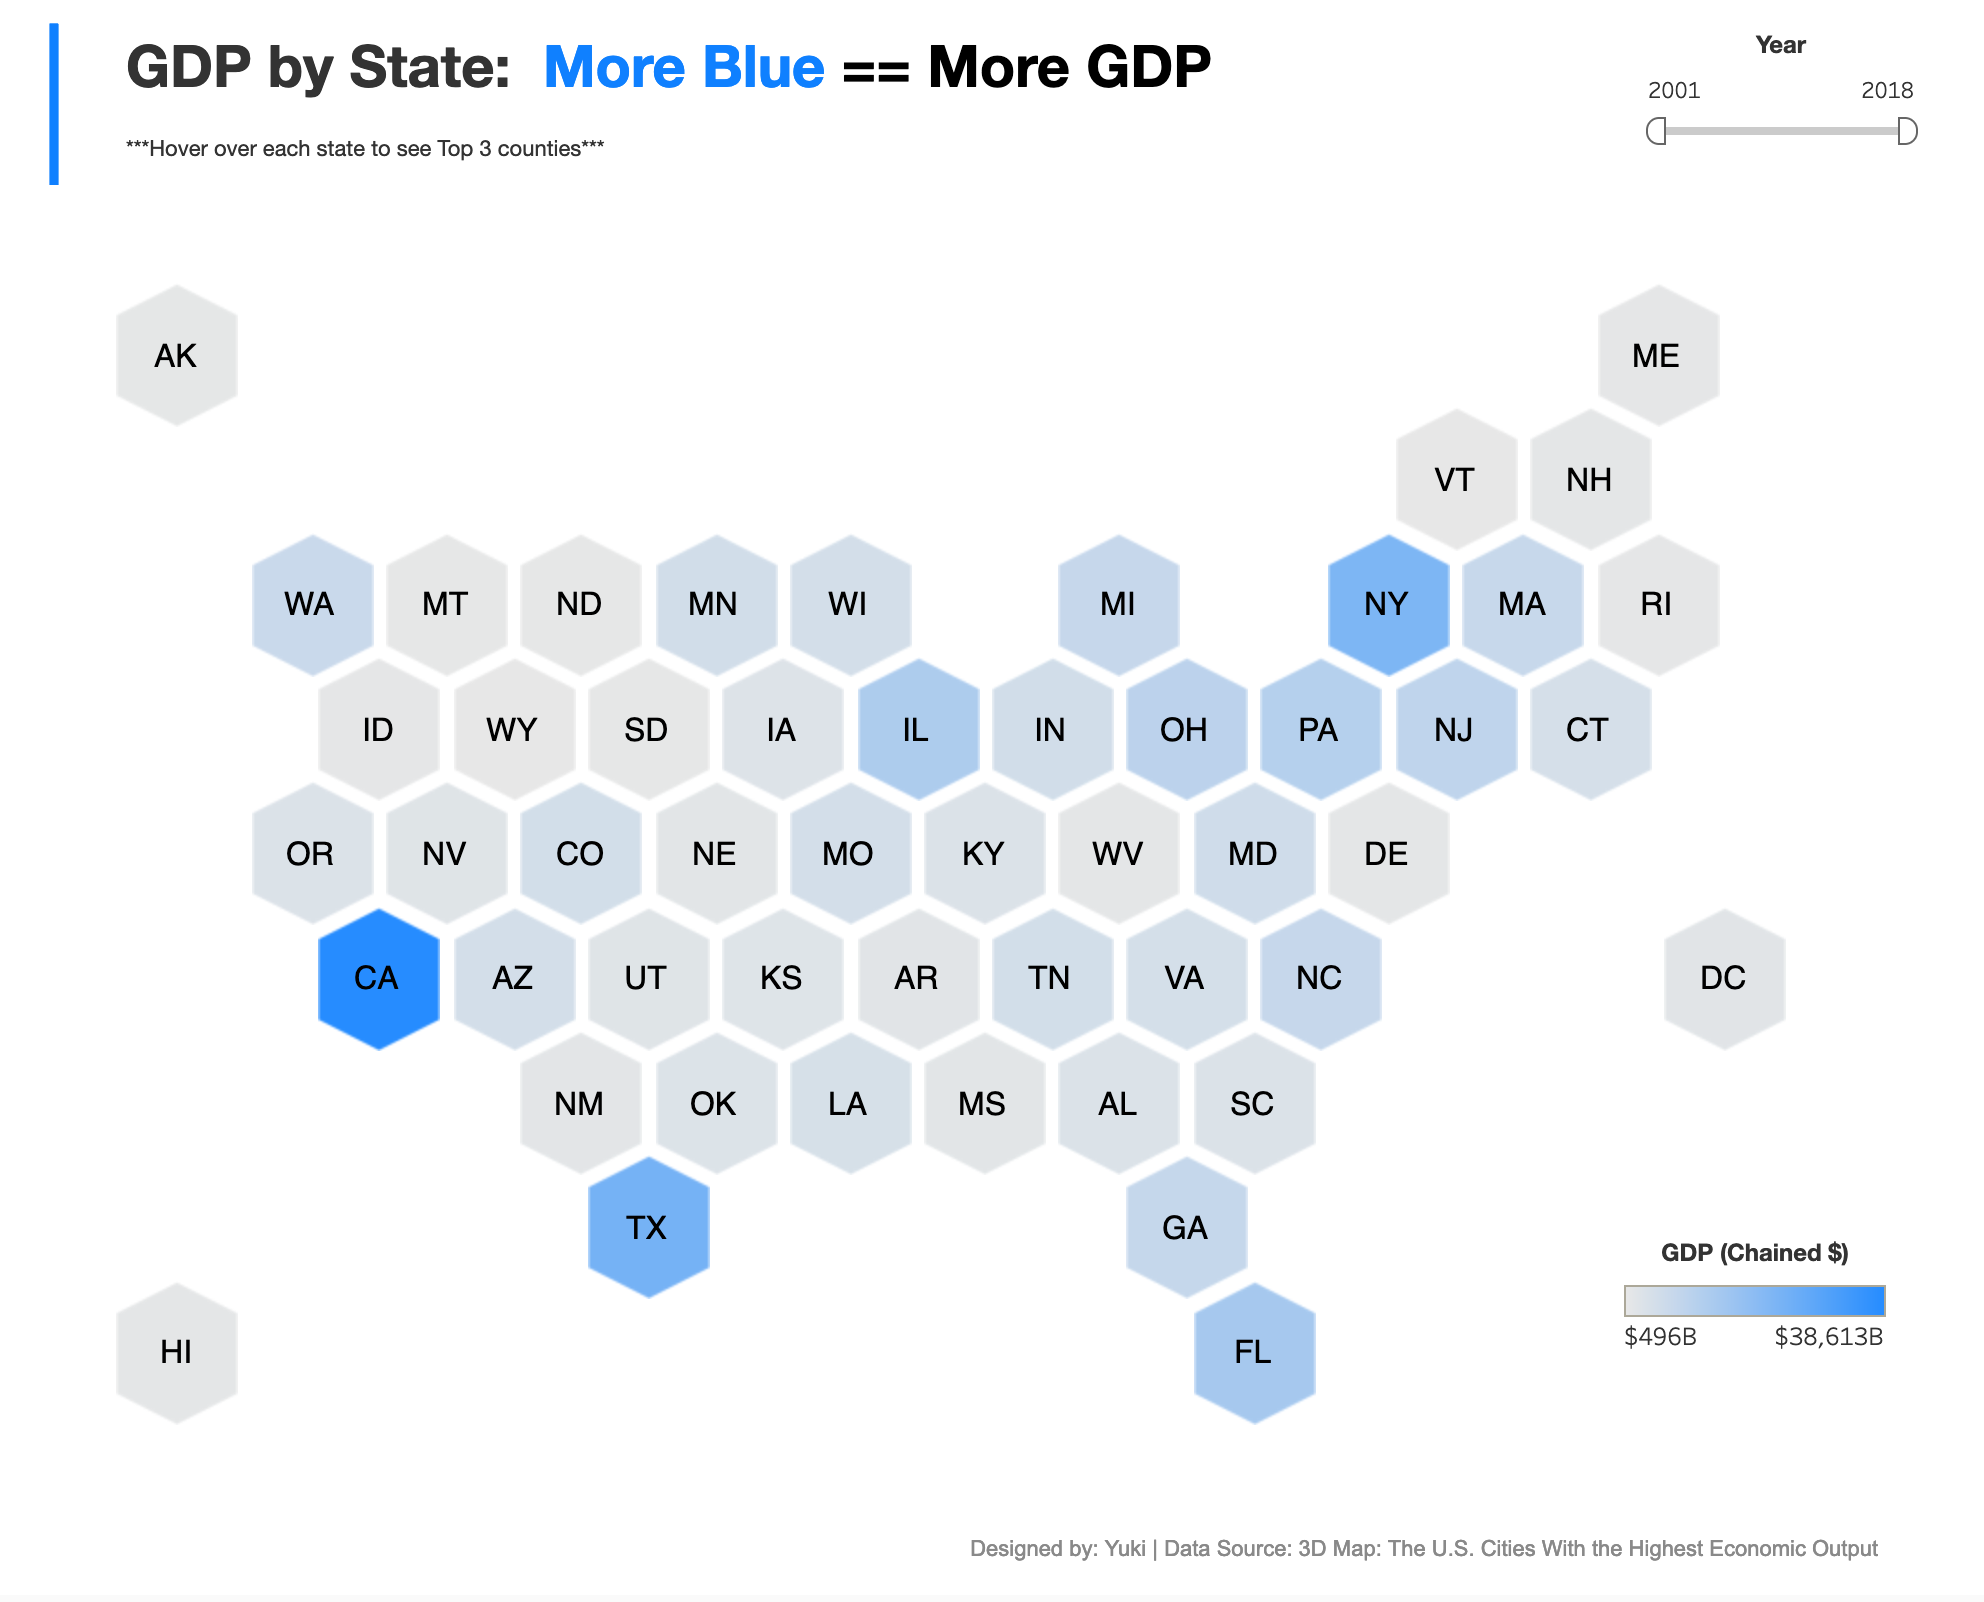
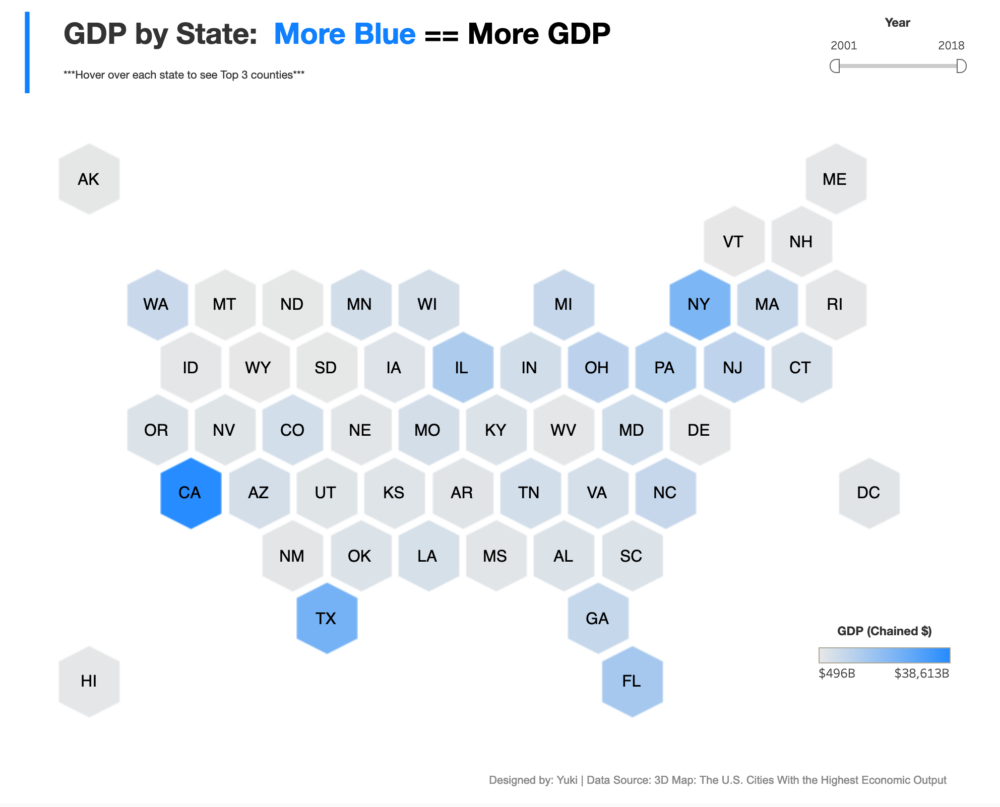
This is a hexagon tile map showing GDP for each state in the US. If you hover over, you can actually see the top 3 counties of each state.

Being able to create a tile map natively is an awesome capacity Tableau has and other BI tools may not have! I wanted to go through step by step of how to go about creating a tile map, but that’s for another time. You can download the file and figure out on your own at least. You’ll also find a lot of resources around this if you search on the internet.

Interactive visualization

Leave a Reply Cancel reply

Your email address will not be published. Required fields are marked *

Recent Posts

  • How To Create Views in BigQuery
  • How to Create a Hex Map in Power BI
  • Format All DAX Measures at Once
  • What are Power BI Dataflows?
  • Calculate the Max Sales Amount for Product

Popular Posts

  • A Running Total Calculation with Quick Measure in Power BI
  • How To Copy And Paste Report Page in Power BI
  • How to Fill Dates Between Start Date and End Date in Power BI (Power Query)
  • Year-Over-Year Calculation: Time Intelligence in Power BI
  • Network Visualizations in Python

connect with me

  • LinkedIn
  • Twitter
  • Github
©2023 Stuff by Yuki | Powered by SuperbThemes & WordPress