
How to Calculate a Running Total in Power BI
I was able to utilize a quick measure to get a running total calculation this project (WoW 2021 Week23). Complex calculations are made easy in DAX so that non-technical folks won’t have much difficulty in creating those calculations for their projects.
What is a Running Total?
In short, a running total is a cumulative sum of a numerical value. For example, if you own a shoe store, and you had sales of $100 in January, $100 in February, and $500 in March. Then your running total of sales at the end of January is $100, at the end of February is $200, and at the end of March is $700.
How to Create a Running Total in Power BI
A running total is one of the common calculations you may need when building a report / dashboard. In Power BI, you can calculate a running total by either manually constructing complex DAX from scratch or using a built-in functionality called Quick Measure in Power BI desktop.
This time, I demonstrate how to create a running total calculation using a quick measure. I’m using a dataset provided for one of the WoW2021 Power BI projects. Here is the link to the dataset.
- You first click on the table you want to create a measure for and choose “quick measure” option

2. Look for and choose the calculation you want to do from the drop-down menu.
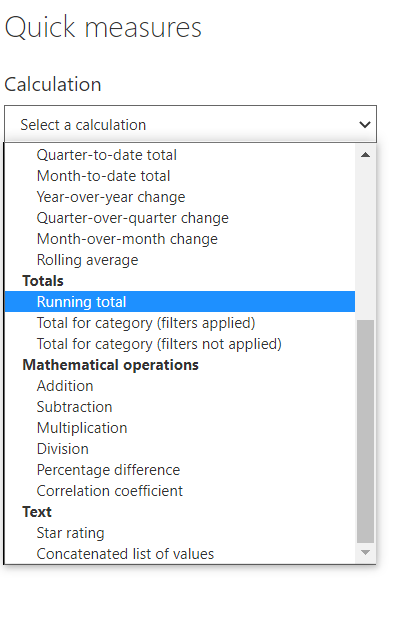
After choosing a calculation, you should see “Base value” and “Field”.
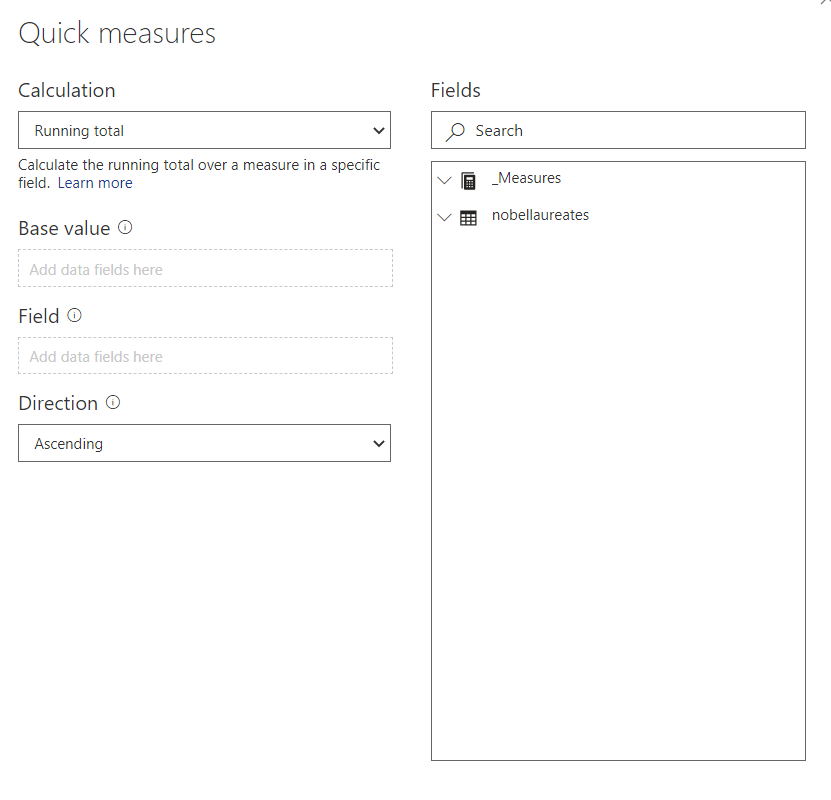
3. Drop a numeric value in to “Base value”. And drop whatever time value you want to use for the axis into “Field”. For my case, it’s Award Year.

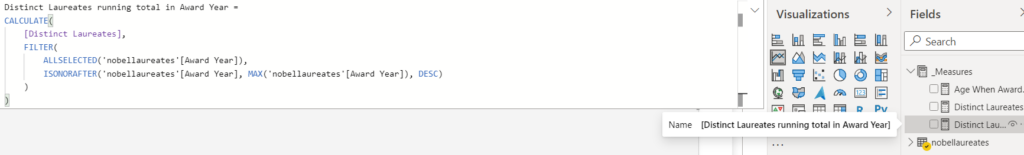
Finally, make sure your measure has been created.
Quick Measure is a great functionality that enables to create complex calculations that you might’ve thought you couldn’t. Keeping mind that it’s always good to check the measure created using quick measure to make sure that it works and makes sense.
Here are some resources I used for the project: