Menu
Stuff by Yuki
  • Home
  • Python
  • Power BI
  • Tableau
  • Community
    • Makeover Monday
    • Workout Wednesday
  • About
  • Contact
Stuff by Yuki

Greenhouse Gas Emission Across Supply Chain

Posted on May 22, 2021

MoM 2020 Week16 – Tableau

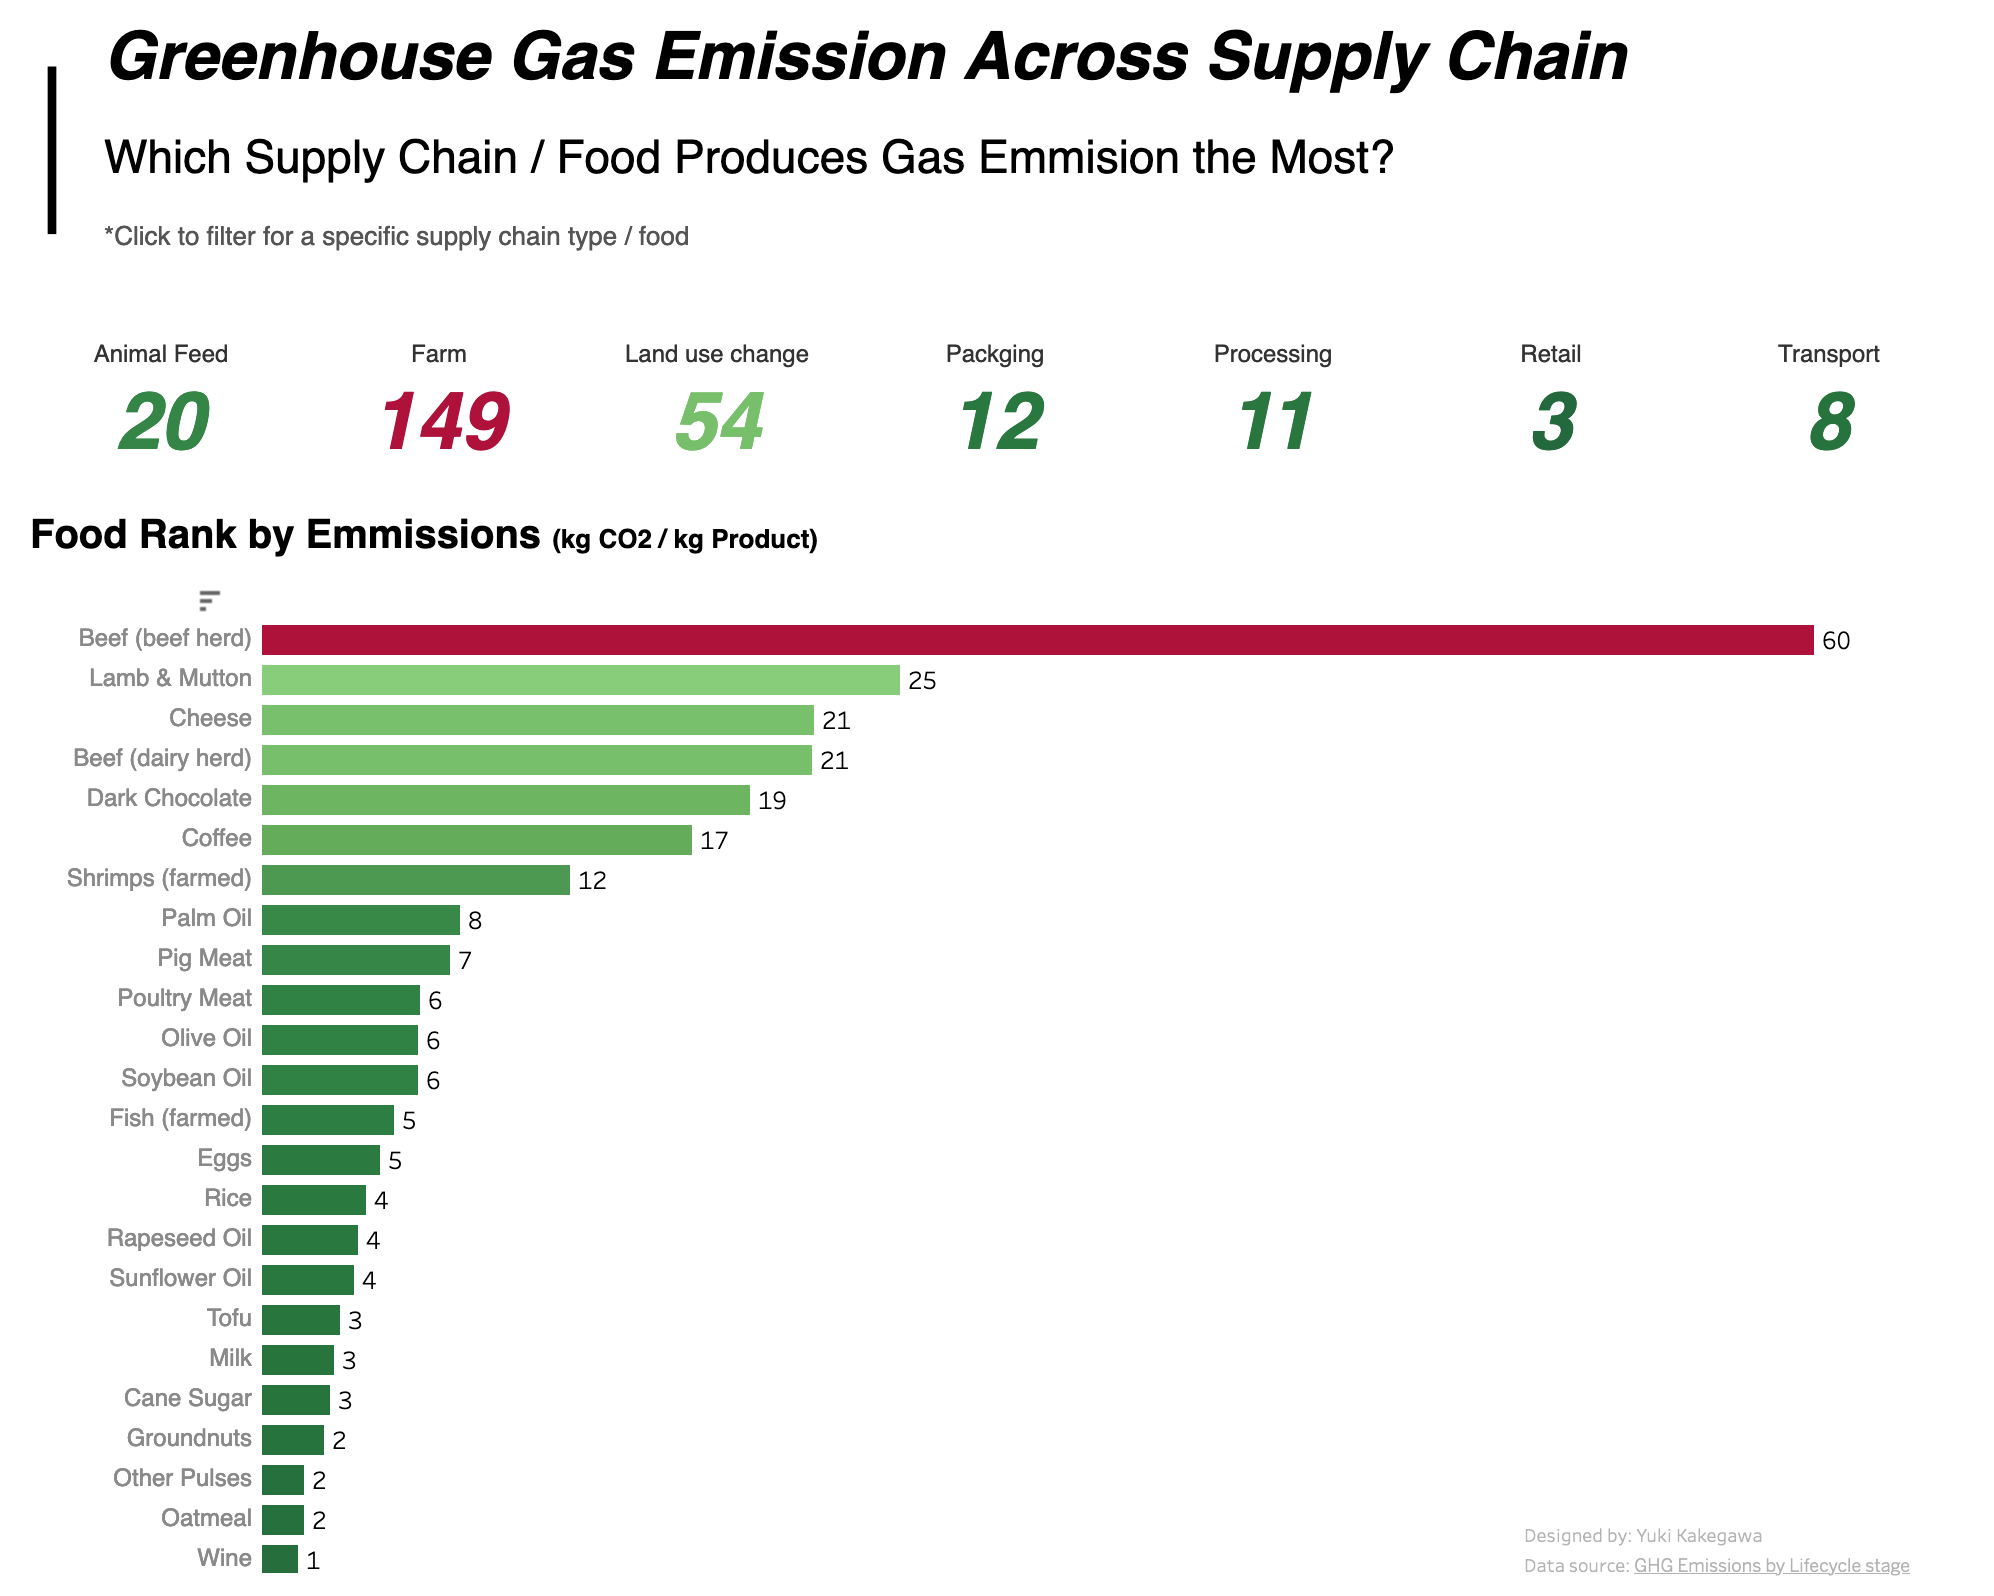
Beef has the worst gas emissions across supply chain! I’ve heard that eating plant based foods is the best thing humans can do to reduce gas emissions, but this data confirms that information.

This is why we need to look at data to see what is actually happening! We also need to have the mindset to accept the negative results that data might tell us.

Interactive visualization

Leave a Reply Cancel reply

Your email address will not be published. Required fields are marked *

Recent Posts

  • How to Convert String to Date or Datetime in Polars
  • Aggregations Over Multiple Columns in Polars
  • DuckDB with Polars, Pandas, and Arrow
  • Read from and Write to Amazon S3 in Polars
  • Handling Missing Values in Polars

Popular Posts

  • A Running Total Calculation with Quick Measure in Power BI
  • How To Copy And Paste Report Page in Power BI
  • How to Fill Dates Between Start Date and End Date in Power BI (Power Query)
  • Year-Over-Year Calculation: Time Intelligence in Power BI
  • Network Visualizations in Python

connect with me

  • LinkedIn
  • Twitter
  • Github
©2023 Stuff by Yuki | Powered by SuperbThemes & WordPress