MoM 2020 Week4 – Tableau
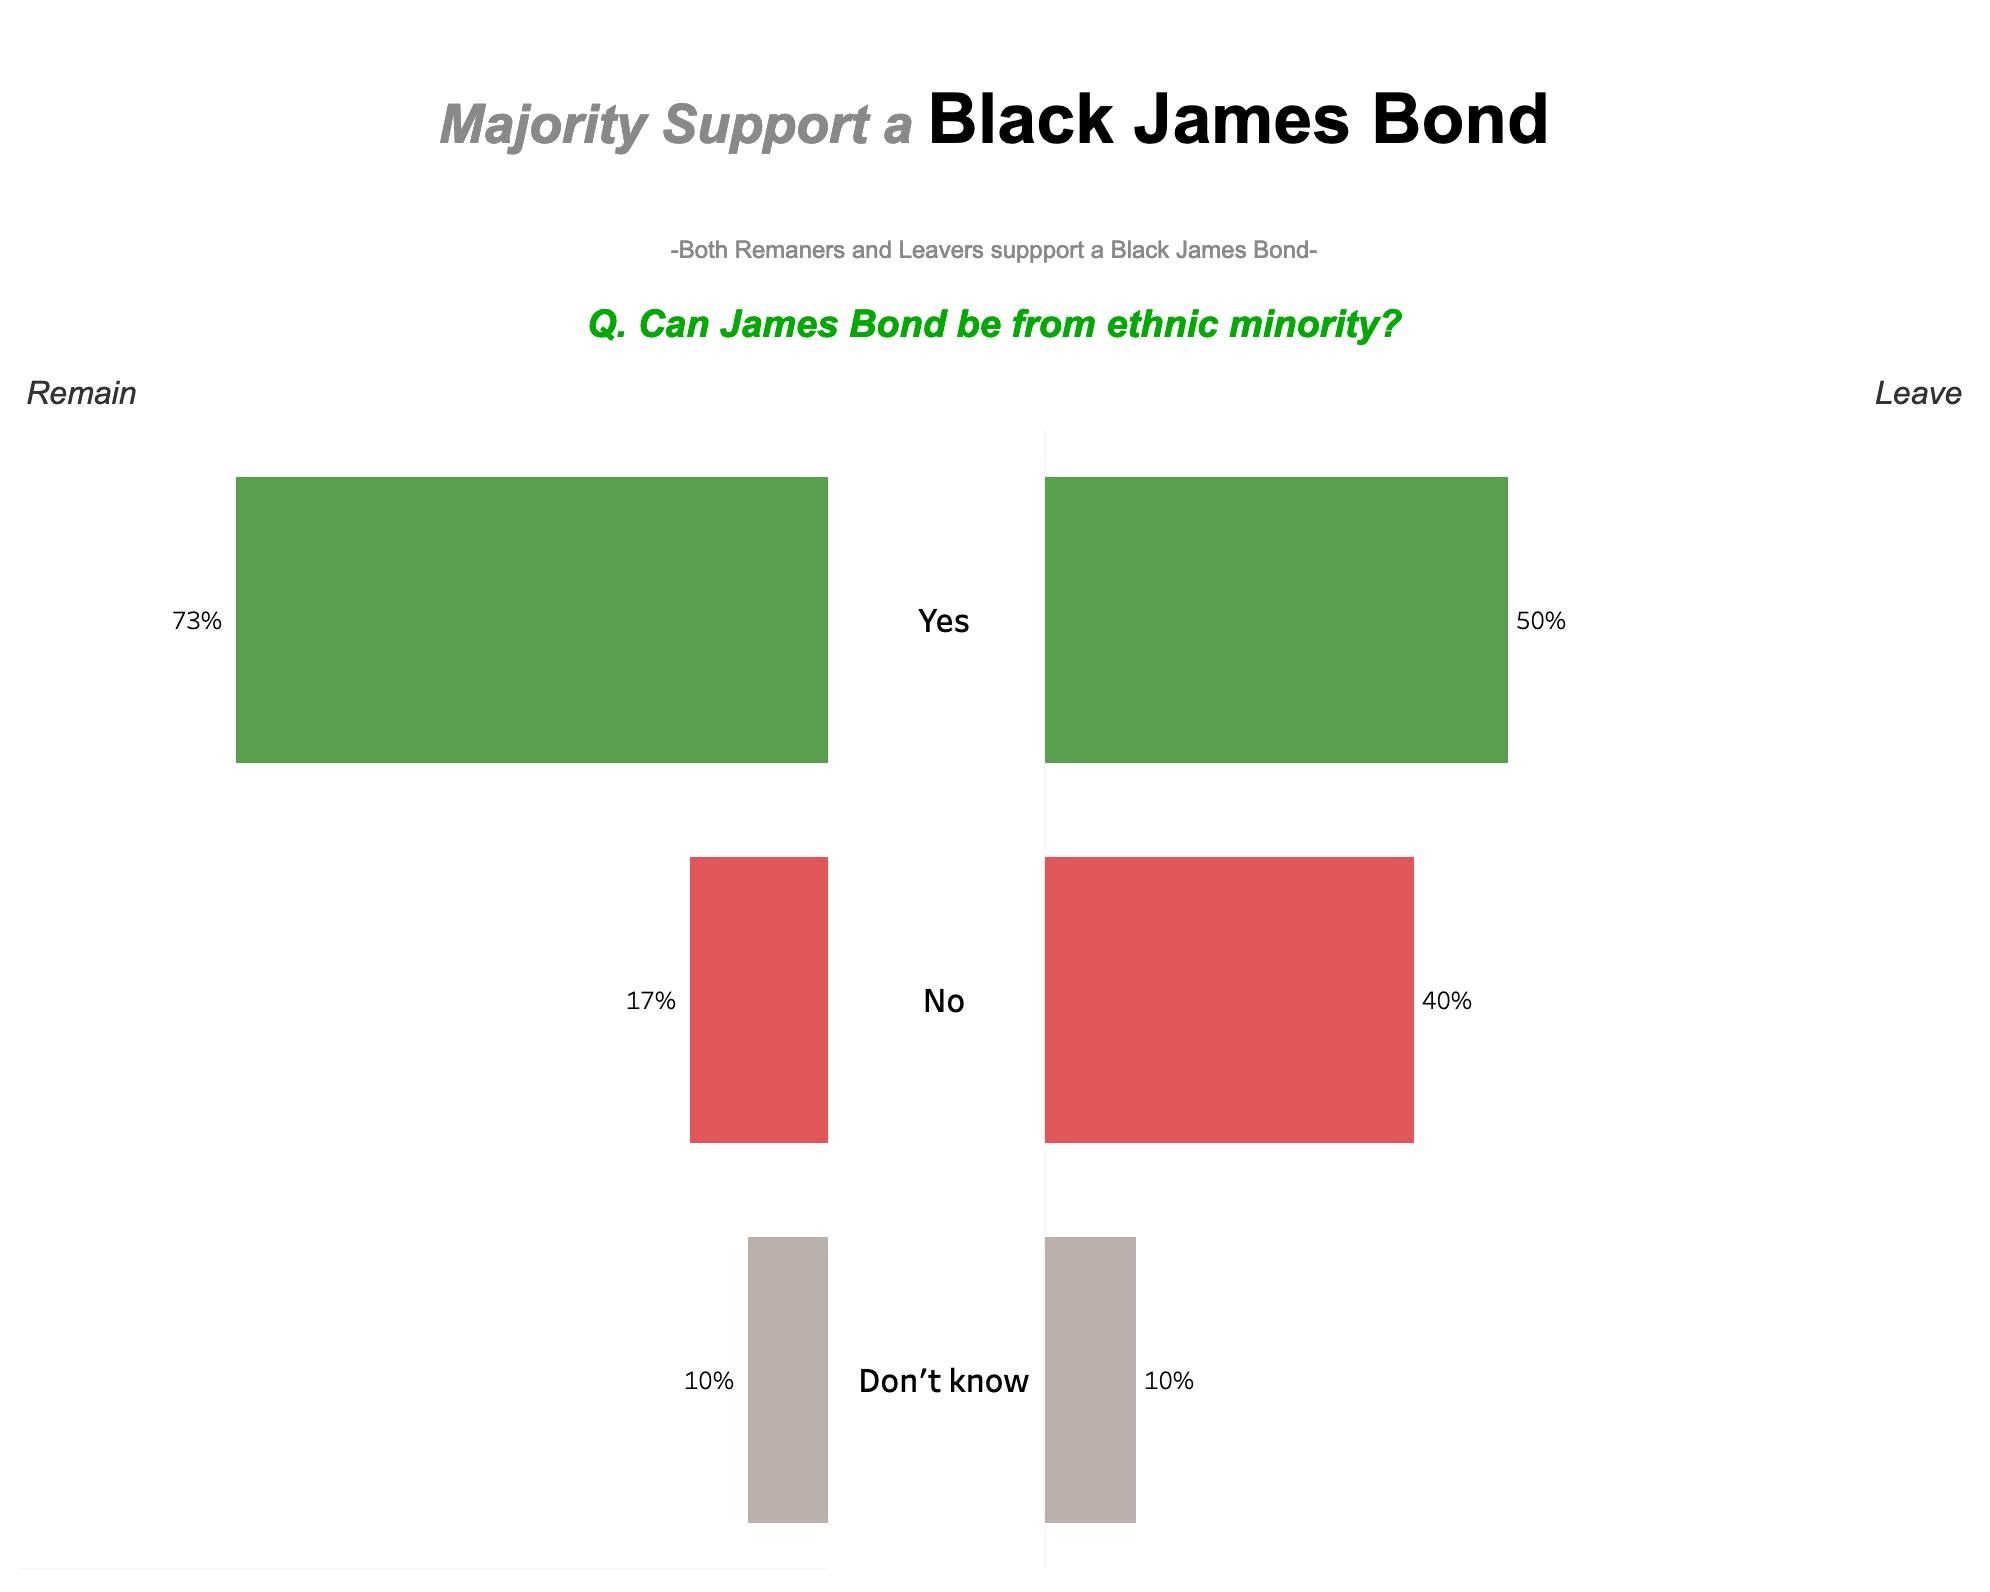
This time, I was to create a visualization to show how people were supportive of black James Bond. I remember struggling creating this particular visual where a label in the middle and bars on both sides.
Data Source | Interactive data visualization