WoW 2021 Week19 – Power BI
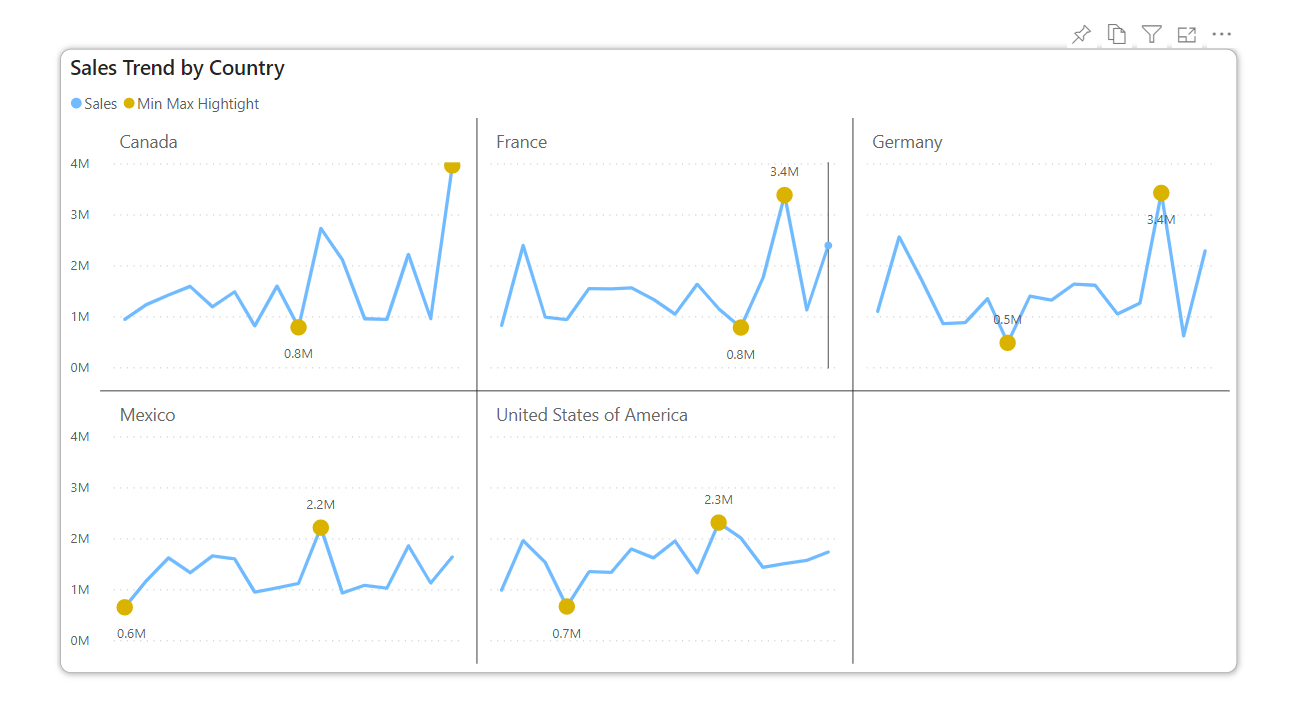
This week, I was to create a line chart whose minimum and maximum values are highlighted. I had never encountered the similar situation, but thought this is super useful! Being able to implement this in Power BI will be such a great skill to have.
DAX measures I created for this task are not as complicated as I thought they would be initially. What I simply did was:
- Create a measure for sum of sales
- Create measures of minx and maxx, keeping mind that which filter I wanted to exclude
- Create a measure with IF statement
Here are a few of my measures I used:
Min Val = CALCULATE( MINX( DateDim, [Sum of Sales] ), ALLSELECTED( DateDim ) )
For the measure above, you need to think about the filter context, thus I used ALLSELECTED() function. You can refer what it does to the Microsoft documentation.
Sales Min and Max =
var minValue = [Min Val]
var maxValue = [Max Val]
RETURN
IF( minValue = [Sum of Sales] || [Max Val] = [Sum of Sales], [Sum of Sales],
    //else
    BLANK() )
Since [Min Val] and [Max Val] are not taking into account of the filter context of Date, you can do the comparison like shown in the code.
You might’ve assumed you’d create and use only one measure for highlighting purposes, but the solution I came up with was to use 2 measures for a line chart; one showing a normal trend, the other gets turned on only when the value is minimum or maximum. There may be other ways to accomplish the same, so please let me know if you find a better way!