Menu
Stuff by Yuki
  • Home
  • Python
  • Power BI
  • Tableau
  • Community
    • Makeover Monday
    • Workout Wednesday
  • About
  • Contact
Stuff by Yuki

Messi vs Ronald – Which Player is Better?

Posted on May 22, 2021

MoM 2020 Week15 – Tableau

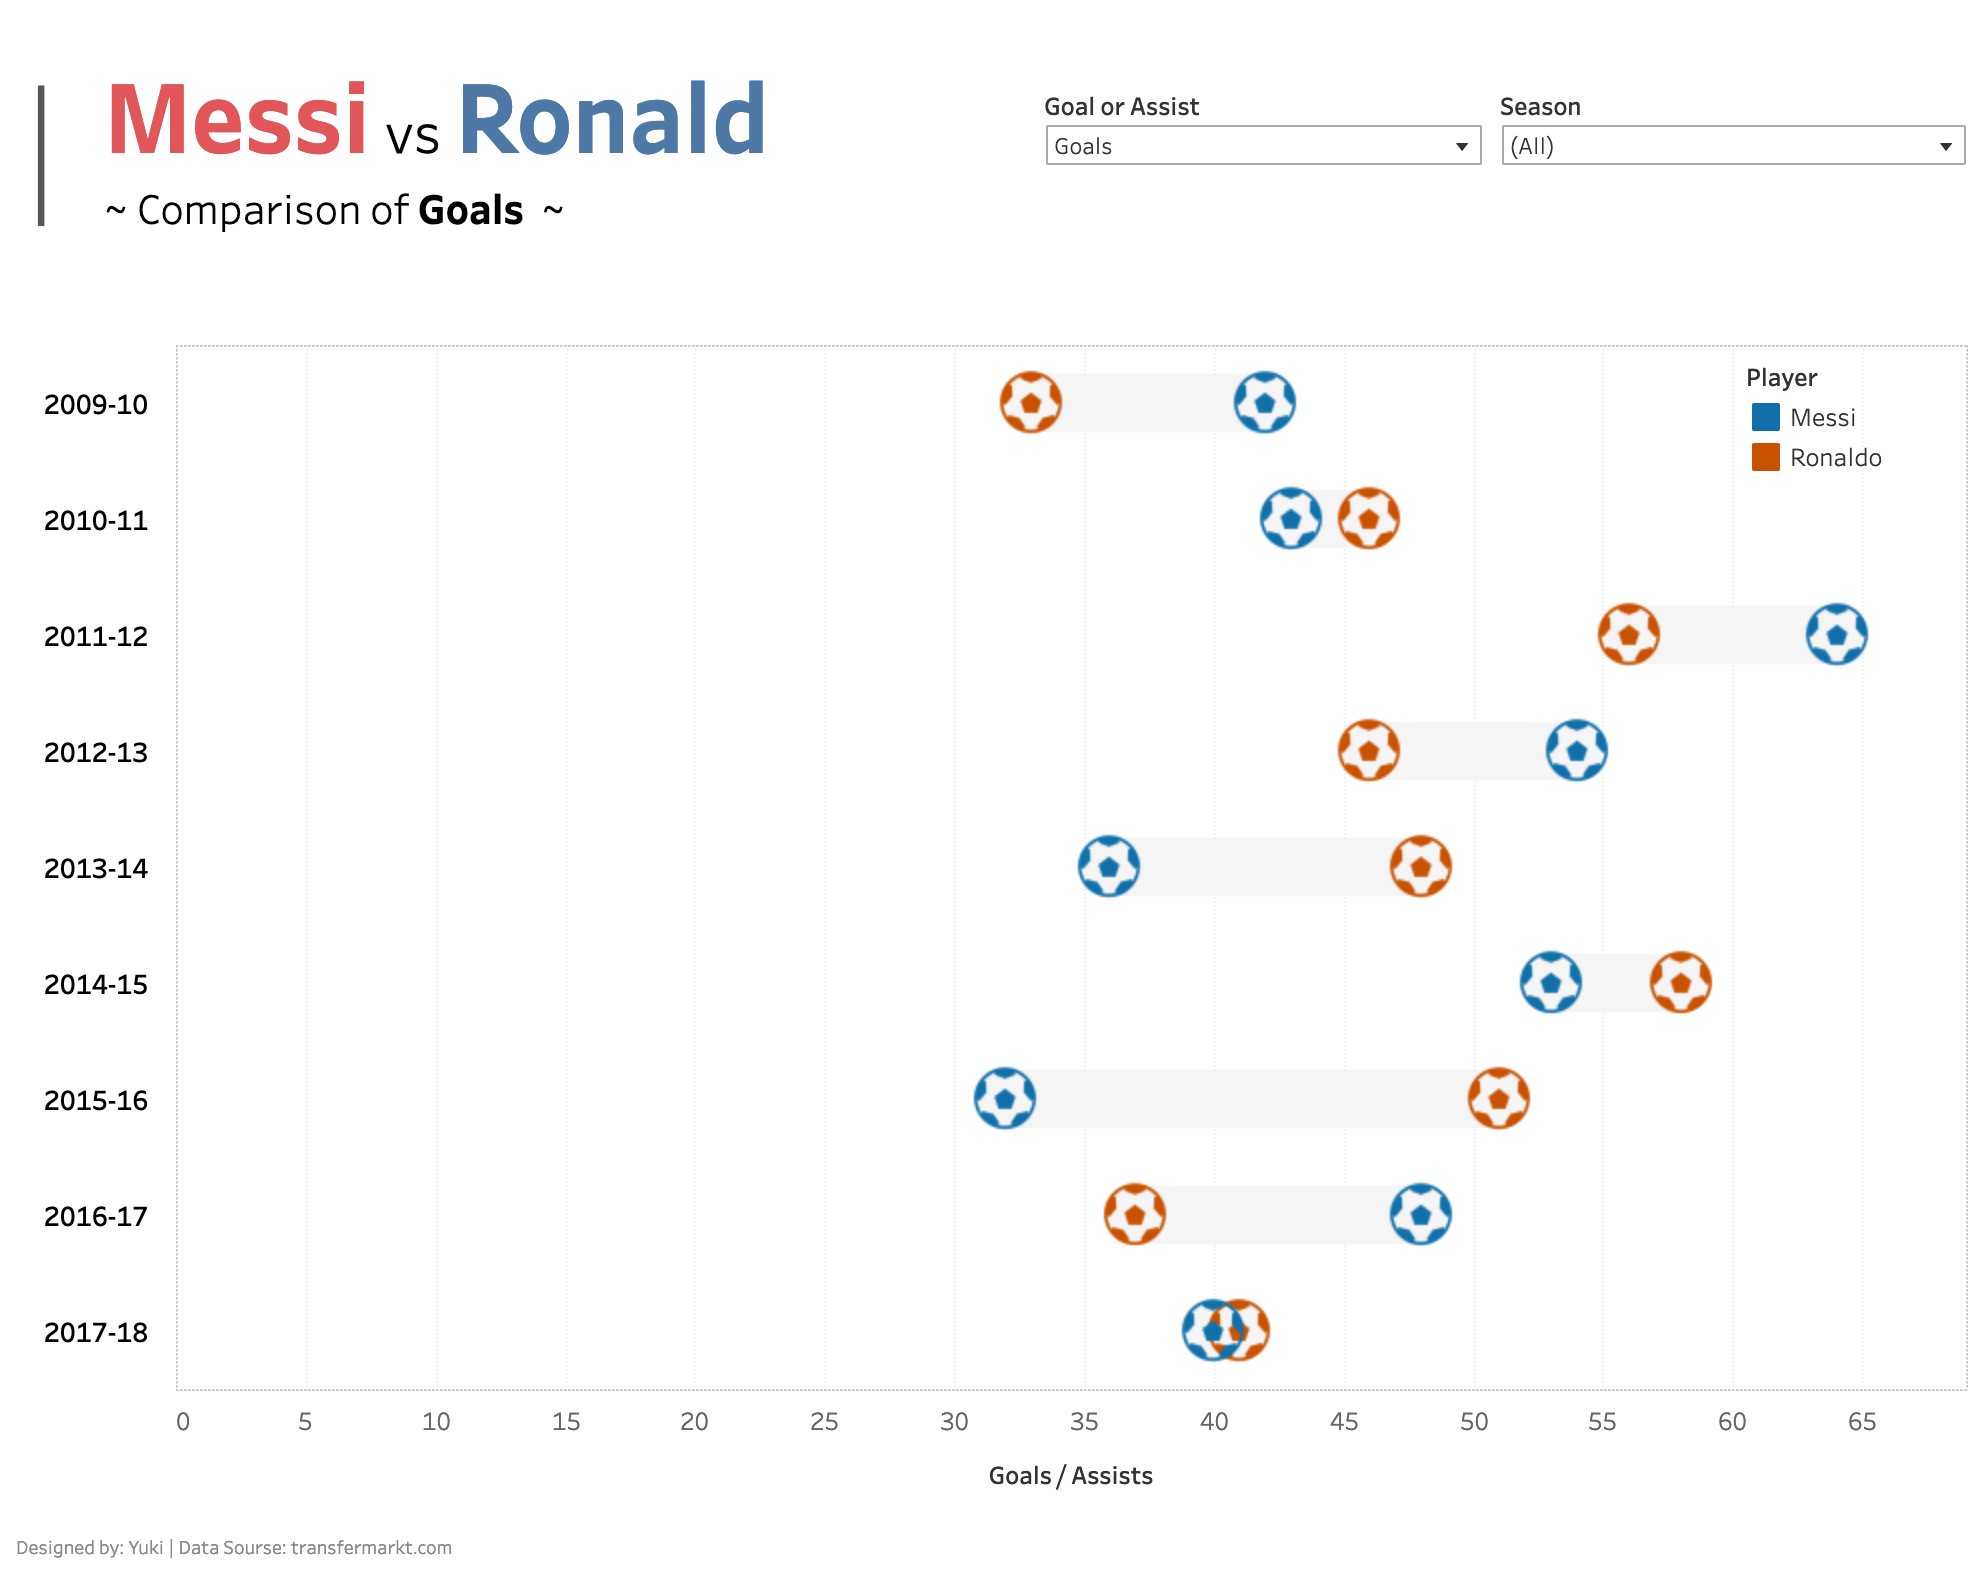
Messi and Ronald, they are both great soccer players, but which one is actually better? The answer to that questions is shown in this visualization.

Tableau allows us to show each data point as a circle so that we can compare them side by side. I don’t recall the name of this visual, but this way of showing a comparison is effective if you can clarify which data point is what.

The use of icons make the visual more appealing to look at, which shouldn’t be the primary focus, but it can be useful for the users’ engagement.

Interactive visualization

Leave a Reply Cancel reply

Your email address will not be published. Required fields are marked *

Recent Posts

  • What are Power BI Dataflows?
  • Calculate the Max Sales Amount for Product
  • Convert DataFrame to Series in Polars
  • Pandas vs Polars – Speed Comparison
  • Polars with DuckDB – Using SQL in Polars

Popular Posts

  • A Running Total Calculation with Quick Measure in Power BI
  • How To Copy And Paste Report Page in Power BI
  • Year-Over-Year Calculation: Time Intelligence in Power BI
  • How to Fill Dates Between Start Date and End Date in Power BI (Power Query)
  • Network Visualizations in Python

connect with me

  • LinkedIn
  • Twitter
  • Github
©2023 Stuff by Yuki | Powered by SuperbThemes & WordPress