Menu
Stuff by Yuki
  • Home
  • Python
  • Power BI
  • Tableau
  • Community
    • Makeover Monday
    • Workout Wednesday
  • About
  • Contact
Stuff by Yuki

Detecting If Value Is Filtered in Power BI

Posted on June 2, 2021July 28, 2021

WoW 2021 Week18 – Power BI

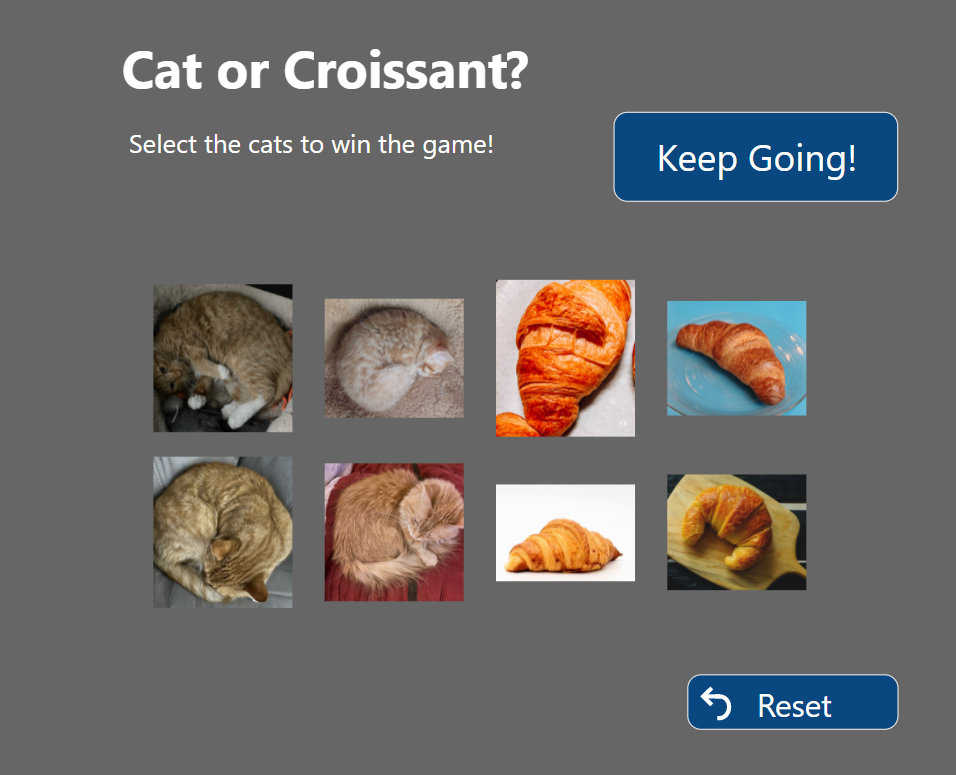
In this exercise, I implemented ISFILTERED() function in DAX. I was to create a simple game where the user selects pictures of either a cat or croissant, and they are to select only cats to win the game.

I didn’t have a solution at first, but I eventually came up with a solution; use a slicer visual.

My solution includes detecting if the image column is filtered or not, which involves ISFILTERED() function. I needed to create the whole logic with some numerical values as well.

DAX makes it possible to implement what seems impossible at first!

The following DAX code is the only thing I needed to create for this game to work:

Status = 
var score = SUM( catorcroissantdata[iscat] )
var minValue = MIN( catorcroissantdata[iscat] )
var maxValue = MAX( catorcroissantdata[iscat] )

RETURN 

SWITCH( TRUE(),
    score = 4, "You Win!",
    minValue = -1 && ISFILTERED( catorcroissantdata[image] ), "You Lose...",
    //else
    "Keep Going!"
)

Data Source | Source Code

Leave a Reply Cancel reply

Your email address will not be published. Required fields are marked *

Recent Posts

  • What are Power BI Dataflows?
  • Calculate the Max Sales Amount for Product
  • Convert DataFrame to Series in Polars
  • Pandas vs Polars – Speed Comparison
  • Polars with DuckDB – Using SQL in Polars

Popular Posts

  • A Running Total Calculation with Quick Measure in Power BI
  • How To Copy And Paste Report Page in Power BI
  • Year-Over-Year Calculation: Time Intelligence in Power BI
  • How to Fill Dates Between Start Date and End Date in Power BI (Power Query)
  • Network Visualizations in Python

connect with me

  • LinkedIn
  • Twitter
  • Github
©2023 Stuff by Yuki | Powered by SuperbThemes & WordPress