MoM 2020 Week2 – Tableau
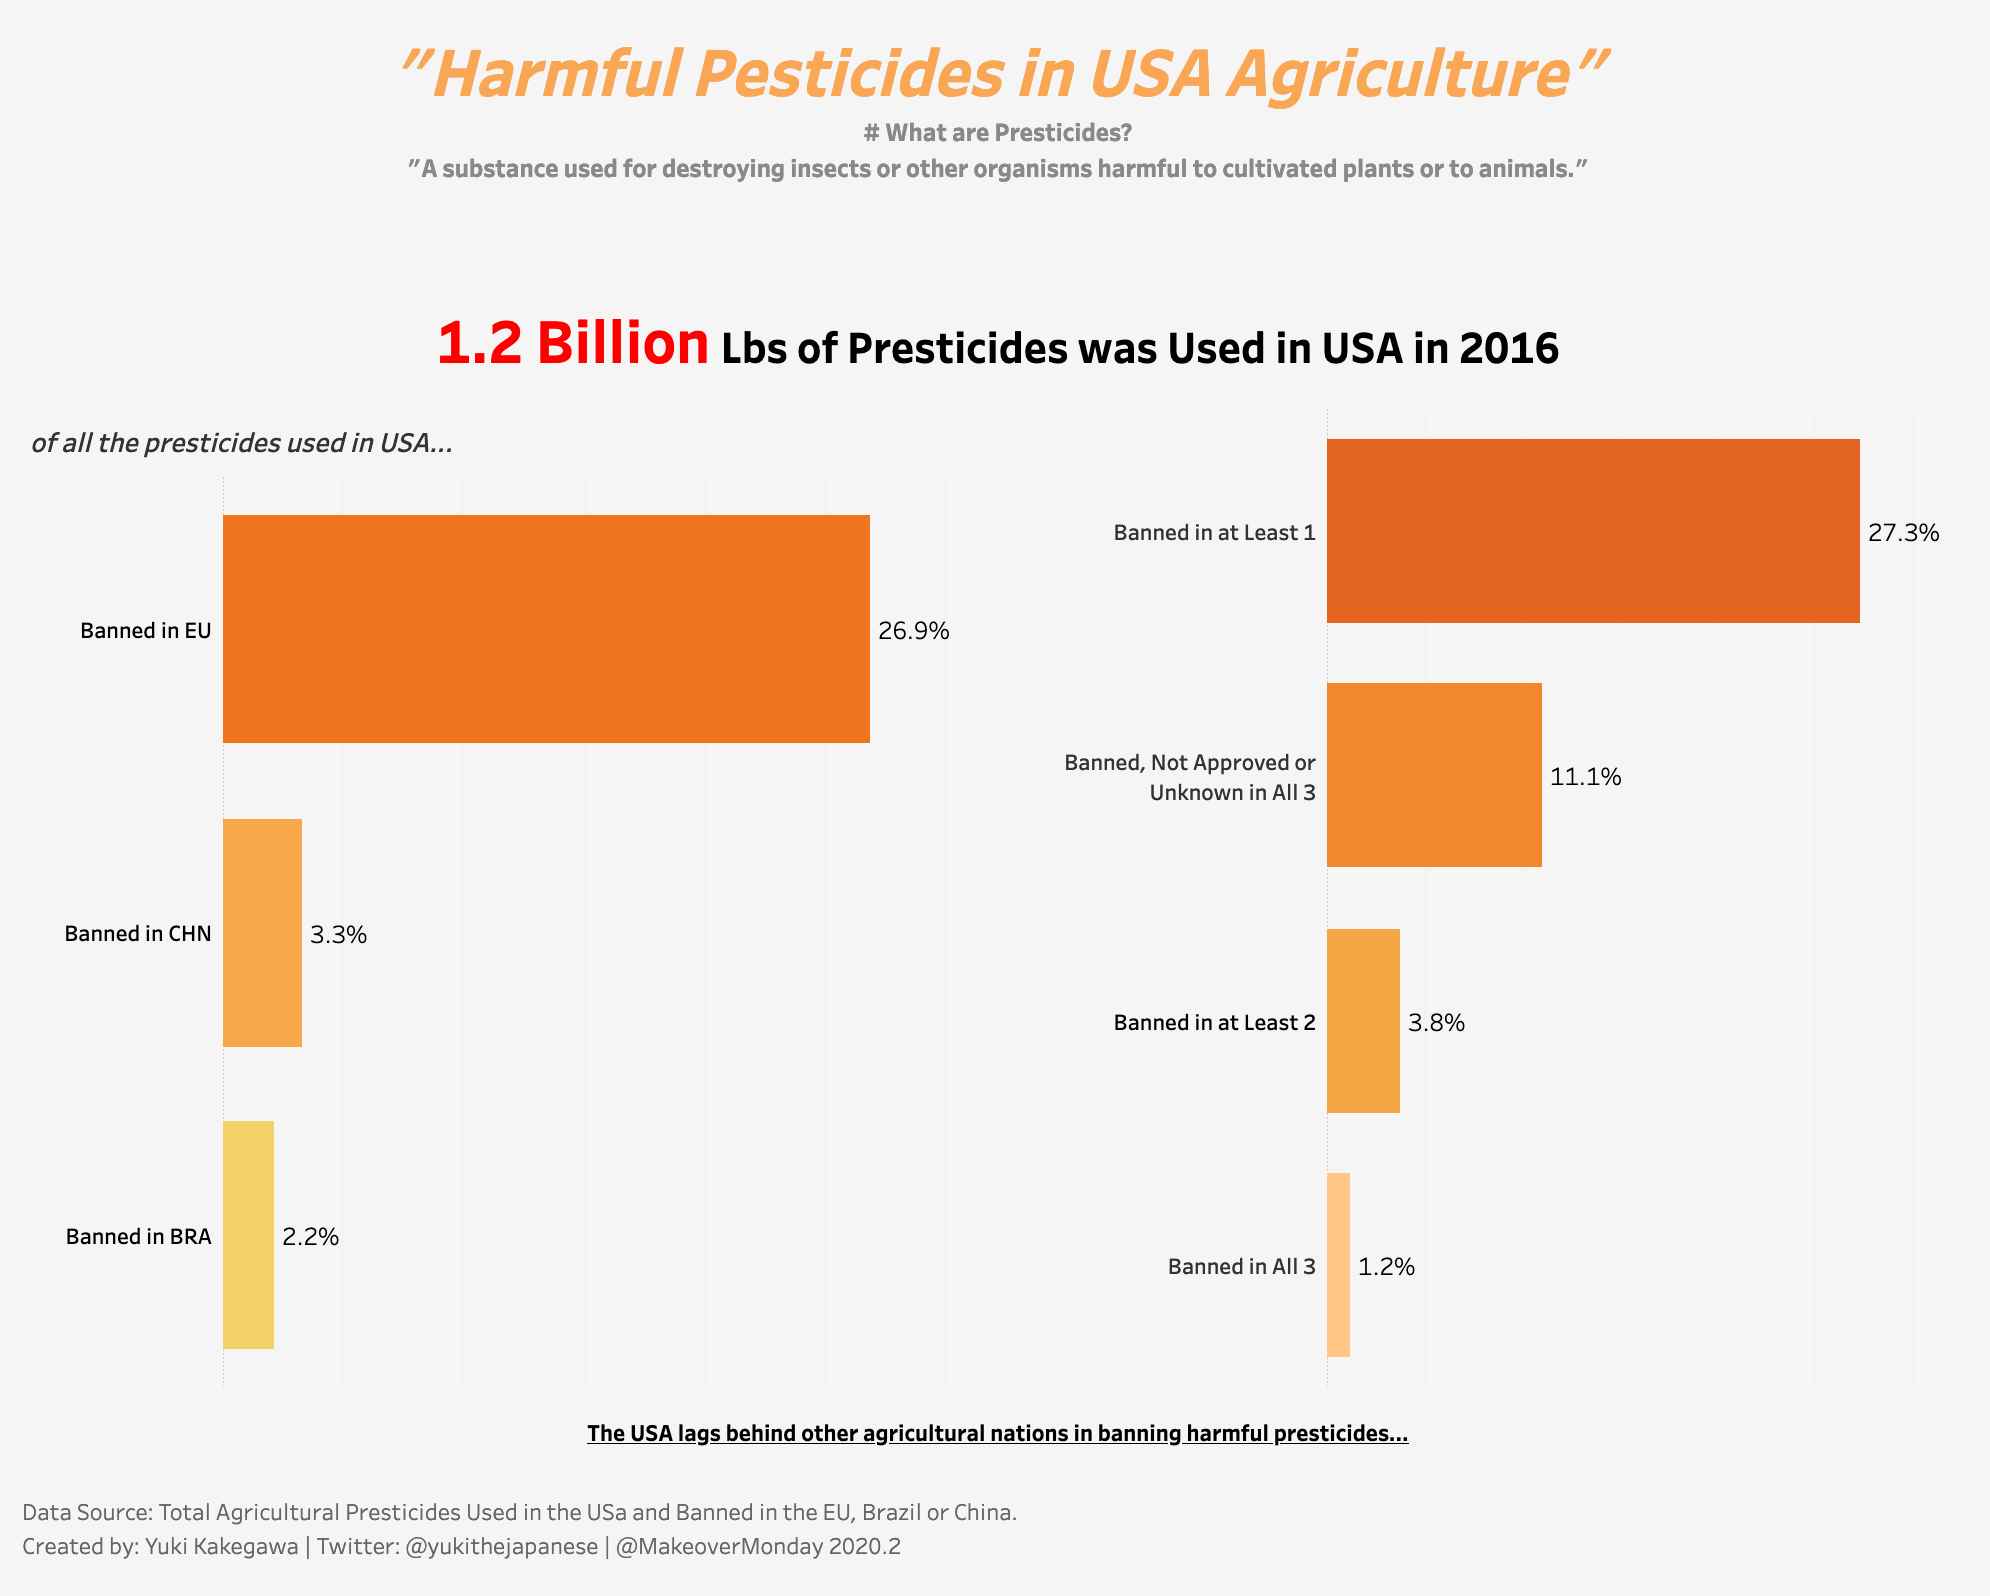
The data visualization I created for Makeover Monday 2020 Week2. It shows the use of harmful pesticides in US agriculture.
I can literally see how I wasn’t used to using Tableau at the time I created this… But looking at my recent projects and comparing this visualization, I can see my progress!
Link to the interactive visualization
