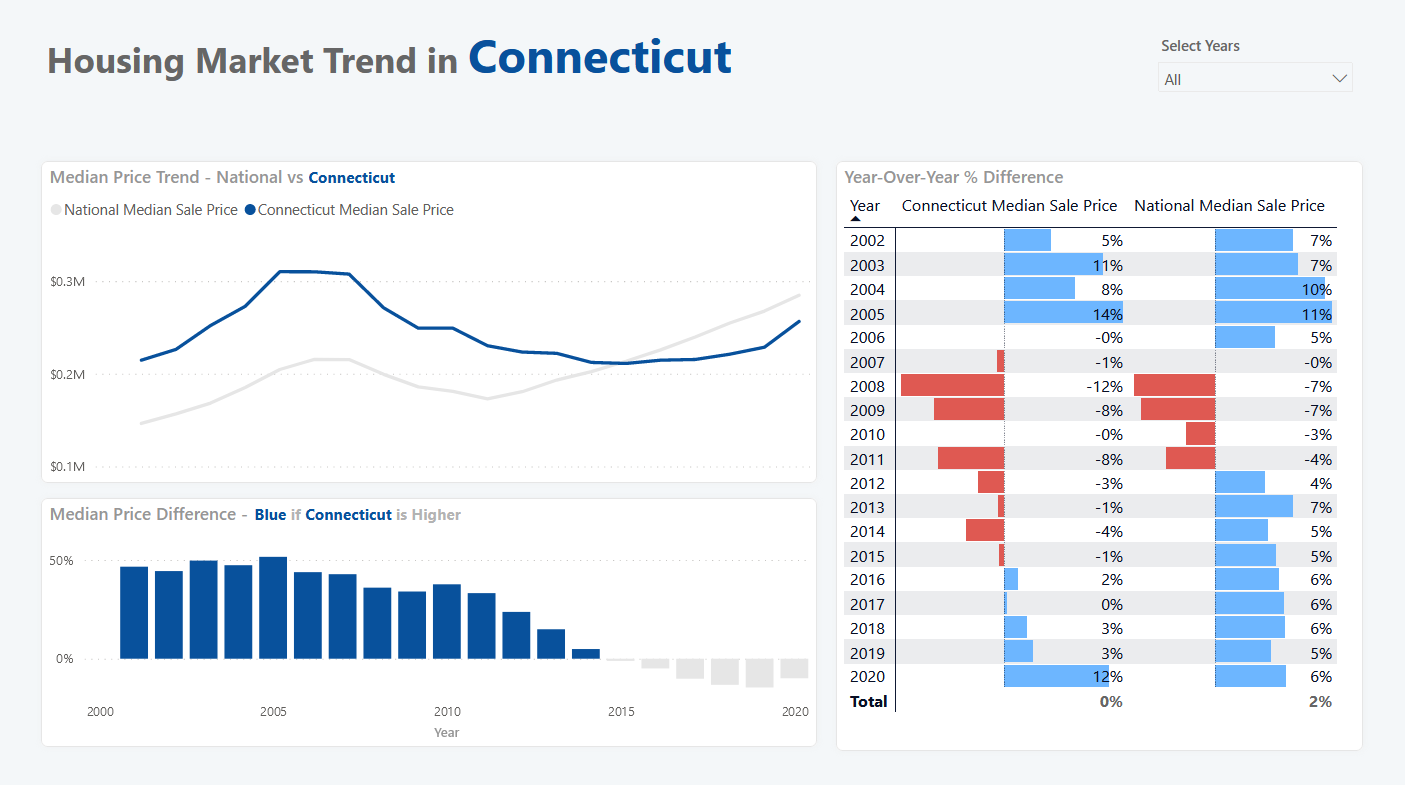
Year-Over-Year Calculation With SAMEPERIODLASTYEAR
I worked on this as part of WoW 2021 Week21. I had so much fun working on this project! Not necessarily figuring out how to do Year-over-year calculations because they are made pretty easy to implement in DAX.
I thought about the design and story I wanted to tell the audience, so I customized the design a lot and tried to be creative so that the audience may better understand the trends shown in the visualization.
Here’s a Year-over-year calculation in DAX:
Connecticut Median Sale Price YoY =
VAR _samePeriodLastYear =
    CALCULATE (
        [Connecticut Median Sale Price],
        SAMEPERIODLASTYEAR ( DateDim[Date] )
    )
VAR _diff = [Connecticut Median Sale Price] - _samePeriodLastYear
RETURN
    DIVIDE ( _diff, _samePeriodLastYear )
And I also created a measure that changes color conditionally:
Color for % Diff =
IF ( [% Difference from National Median Sale Price] < 0, "#E6E6E6", "#08519C" )
Designing visuals and creating DAX measures are the funnest part of the job 😎
