Have you encountered situations where you’re applying so many transformation on a Polars dataframe that your code is hard to follow? It’s a double edged sword where you can do a lot in Polars, but it could also create a mess.
In this post, I’ll introduce a Polars functionality, pipe(), that helps make your code concise or less cluttered.
I’m using this dataset from prepping data. My code is available in my GitHub repo.
What is Pipe() in Polars
Pipe() is a Polars dataframe functionality that allows you to apply a sequence of functions. If you’re a pandas power user then you might already be familiar with it because it’s also available in pandas as well.
Let’s say you’re applying a filter on a column, instead of applying directly on a dataframe, you’d define a function that does your logic, and reference that in pipe().
Here’s a simple example (from Polars documentation)
Instead of writing code like this:
import polars as pl

df = pl.DataFrame({"a": [1, 2, 3, 4], "b": ["10", "20", "30", "40"]})

df.with_columns(pl.col("b").cast(pl.Int64))
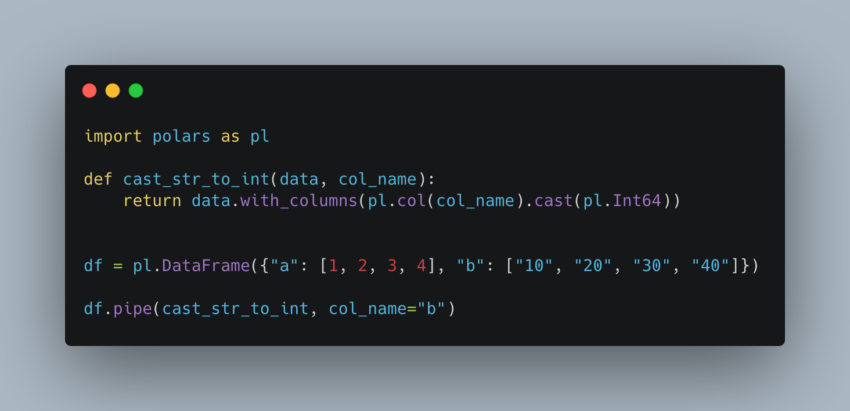
You can do the same with pipe() like this:
import polars as pl

def cast_str_to_int(data, col_name):
    return data.with_columns(pl.col(col_name).cast(pl.Int64))

df = pl.DataFrame({"a": [1, 2, 3, 4], "b": ["10", "20", "30", "40"]})

df.pipe(cast_str_to_int, col_name="b")
You might say the code with pipe() is longer and complicated. But what if your transformations are more complicated and longer? And that’s usually the case in the real world.
How Does Pipe() Help you?
What does pipe() help you with exactly? You’ve already seen that in the code above. I see using pipe() is helpful with:
- Readability
- Testing
- Debugging
Essentially, pipe() helps make your code clearer that it’s easy to read, test, and debug.
Does somebody else need to take over your project? Having pipe() in your code definitely helps them catch up quicker.
Here’s the example code I wrote for a small project. Compare prep.py and prep_no_pipe.py to see how they’re different. Note that I added my own custom functionality to the code (to_title_case). If you’re interested how I’m adding a custom expression, please refer to this post to learn more.
prep.py
import polars as pl
from custom_expressions import CustomStringMethodsCollection

# set to show more rows when print
pl.Config.set_tbl_rows(20)

# read data
file_name = 'Messy Nut House Data.csv'
df = pl.scan_csv(file_name)

# data transformations
def clean_locations(df):
    return (df
            .with_columns(
                pl.col('Location')
                .custom.to_title_case()
                .str.replace_all('0', 'o', literal=True)
                .str.replace_all('3', 'e', literal=True)
                .str.replace_all('Londen', 'London', literal=True)
                .str.replace_all('Livrepool', 'Liverpool', literal=True)
            ))

def pivot_column(df, index_columns, columns, values):
    if isinstance(df, pl.LazyFrame):
        df = df.collect()
    return (df
            .pivot(
                index=index_columns,
                columns=columns,
                values=values,
            )
            .lazy())

def add_revenues_column(df):
    return (df
            .with_columns(
                (pl.col('Price (£) per pack') * pl.col('Quant per Q')).alias('Revenues')
            ))

def add_revenues_and_avg_per_pack(df):
    return (df
            .groupby('Location')
            .agg(
                [
                    pl.sum('Revenues'),
                    pl.mean('Price (£) per pack').round(2)
                ]
            )
            .sort('Location'))

df = (df
      .pipe(clean_locations)
      .pipe(pivot_column, index_columns=['Location', 'Nut Type'], columns='Category', values='Value')
      .pipe(add_revenues_column)
      .pipe(add_revenues_and_avg_per_pack)
      )

print(df.collect())
custom_expression.py
import polars as pl

@pl.api.register_expr_namespace('custom')
class CustomStringMethodsCollection:
    def __init__(self, expr: pl.Expr):
        self._expr = expr

    def to_title_case(self) -> pl.Expr:
        convert_to_title = (
            pl.element().str.slice(0, 1).str.to_uppercase()
            +
            pl.element().str.slice(1).str.to_lowercase()
            )

        converted_elements = (
            self._expr
            .str.split(' ')
            .arr.eval(convert_to_title)
            .arr.join(separator=' ')
            )
        return converted_elements
prep_no_pipe.py
import polars as pl
from custom_expressions import CustomStringMethodsCollection

# set to show more rows when print
pl.Config.set_tbl_rows(20)

# read data
file_name = 'Messy Nut House Data.csv'
df = pl.scan_csv(file_name)

# data transformations
df = (df
      .with_columns(
                pl.col('Location')
                .custom.to_title_case()
                .str.replace_all('0', 'o', literal=True)
                .str.replace_all('3', 'e', literal=True)
                .str.replace_all('Londen', 'London', literal=True)
                .str.replace_all('Livrepool', 'Liverpool', literal=True)
            ).collect()
      .pivot(
                index=['Location', 'Nut Type'],
                columns='Category',
                values='Value',
            )
            .lazy()
      .with_columns(
                (pl.col('Price (£) per pack') * pl.col('Quant per Q')).alias('Revenues')
            )
      .groupby('Location')
            .agg(
                [
                    pl.sum('Revenues'),
                    pl.mean('Price (£) per pack').round(2)
                ]
            )
            .sort('Location')
      )

print(df.collect())
Summary
Hope this post helps you see the benefits of pipe() in Polars. At the end of the day, whether you use pipe() or not is your preference. You might decide just chain methods for your project or maybe use pipe() in production. I’d suggest to use it because it makes your logic or transformations decoupled from each other, which ultimately gives you the benefits I mentioned, readability, testing, and debugging.
