
MoM 2021 Week24 – Power BI
This week’s topic is pretty interesting as many people are or were students once in their lifetime. I hear a lot of people get in to debt in order to attend college in the US, when school is much cheaper or free in some countries.
I’m not to answer whether or not the education system in the US is right or wrong, but the dashboard I created on this subject informs you which state / school has the highest student loan amount in the US.
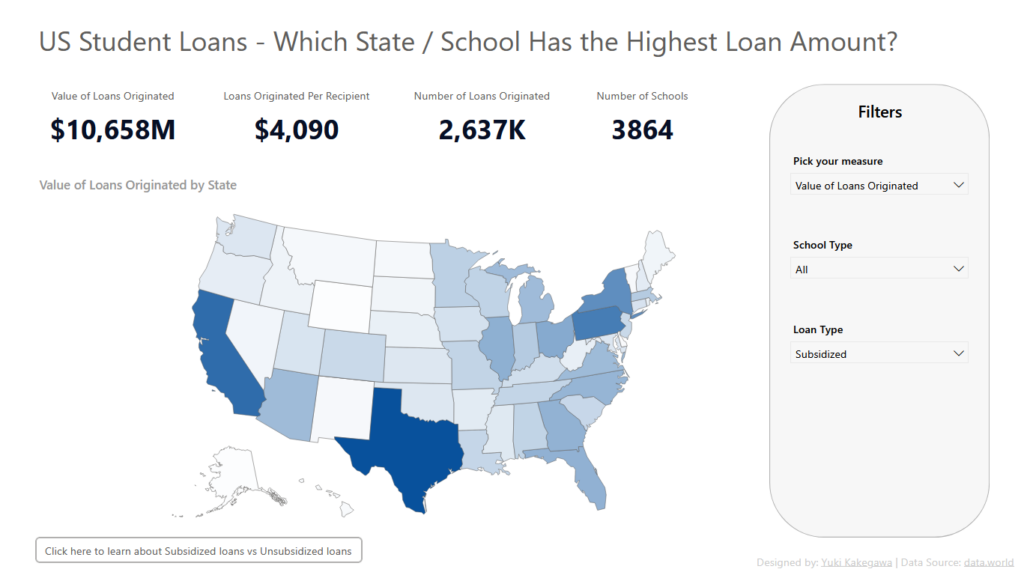
I used a shape map as the main visual as it tells the audience effectively about the data for each state. I also utilized a few DAX measures to make some tricks possible for:
- Users to be able to pick a measure for a visual dynamically
- Dynamic visual titles
- A button that navigates to a website
And here are a few DAX measures I created:
Visual Title =
var _selectedValue = SELECTEDVALUE( 'Measures Dropdown'[Measures] )
var _checkScope =
SWITCH( TRUE(),
        ISFILTERED( Summary[School] ), "School - Top 5",
        "State"
)
RETURN
_selectedValue & " by " & _checkScope
Selected Measure =
var _selectedValue = SELECTEDVALUE( 'Measures Dropdown'[Measures] )
var valueLoansOriginated = SUM( Summary[Value of Loans Originated] )
var loansPerRec = [Loans Originated Per Recipient]
var numLoansOriginated = SUM( Summary[Number of Loans Originated] )
RETURN
SWITCH( TRUE(),
    _selectedValue = "Value of Loans Originated", valueLoansOriginated,
    _selectedValue = "Loans Originated Per Recipient", loansPerRec,
    _selectedValue = "Number of Loans Originated", numLoansOriginated
)
The mechanics of how these work is for another post 😀
Files used for the project: Github
Here is an interactive version of the dashboard: