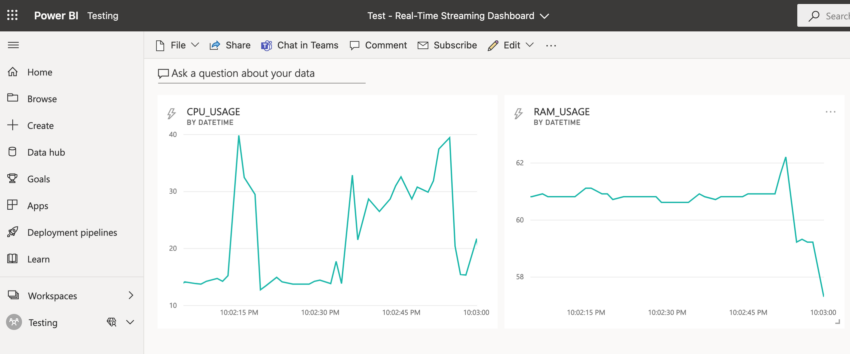
Real-Time Streaming in Power BI
You can do direct query in Power BI which is near real-time, but we have an option for actual real-time streaming! Simply put, live connection and direct query are near real-time, but real-time streaming in Power BI has less latency because it’s essentially “push” model. It’s worth mentioning that you need premium capacity or premium per user license for real-time streaming in Power BI.
We have three types of datasets that enable real-time streaming dashboards.
- Push dataset
- Streaming dataset (Azure stream)
- PubNub dataset
Microsoft has this documentation that explains each dataset in details. I’ll be introducing and walking through setting up a real-time streaming dashboard with a push dataset in this post. And this walk-through assumes you already know how to run/develop Python code in your own machine.
Setting up a Push Dataset and Connect it to a Python Script
To do real-time streaming with a push dataset, you’d first need to set it up in Power BI service.
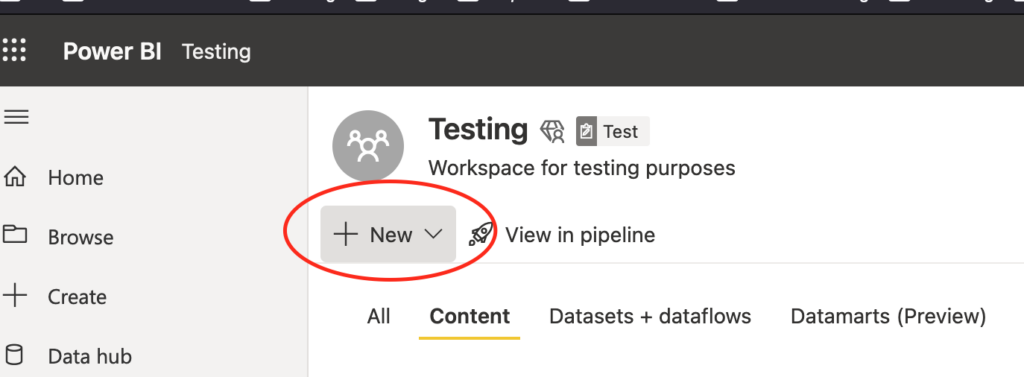
1. You first click on “New” tab and expand the available options.
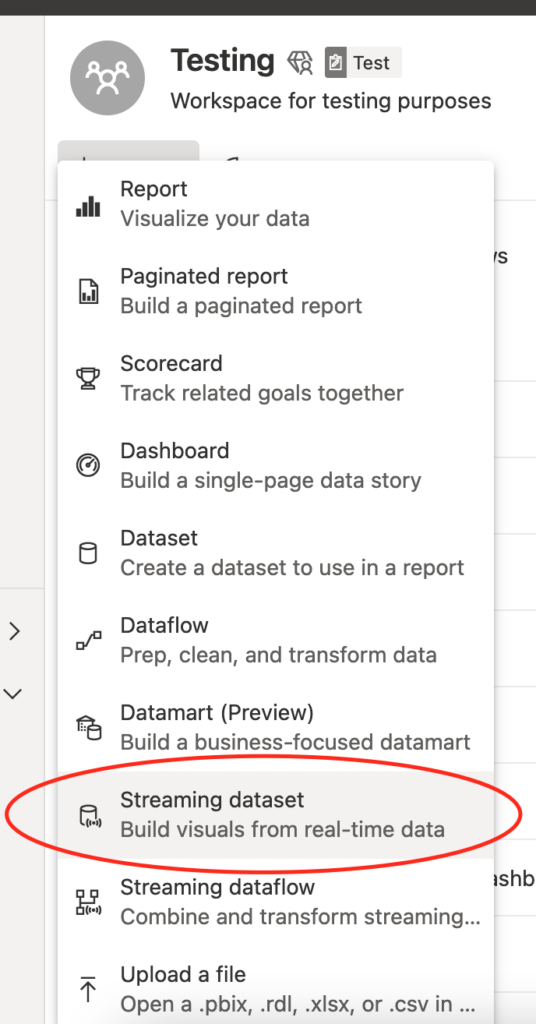
2. Then you’ll see an option for creating a streaming dataset.
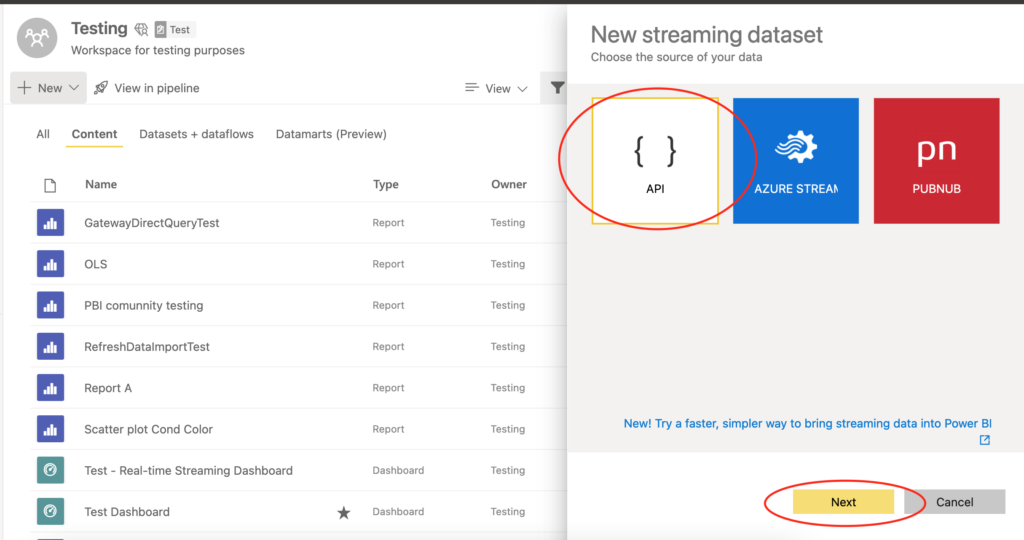
3. And click on “API” option, which is push dataset.
4. You need to type in your dataset name and columns along with their data types.
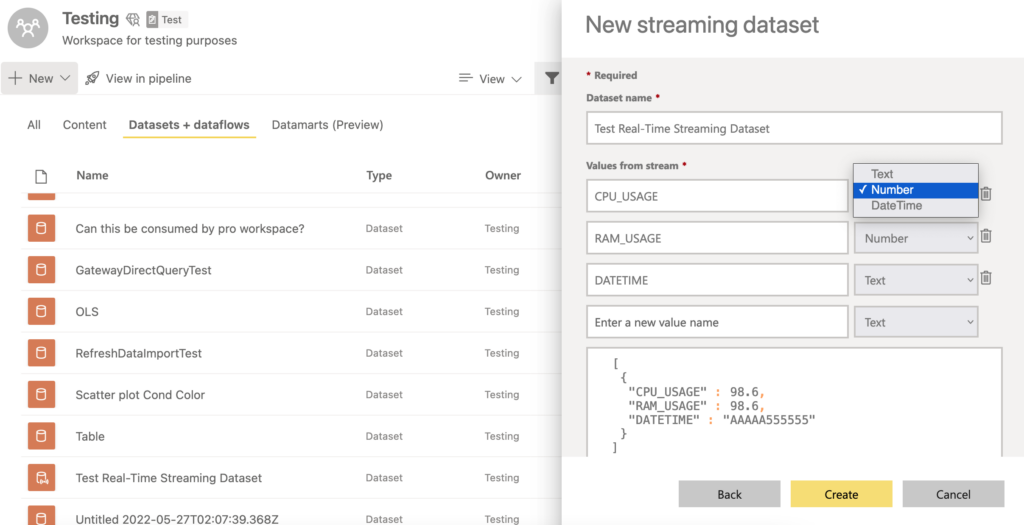
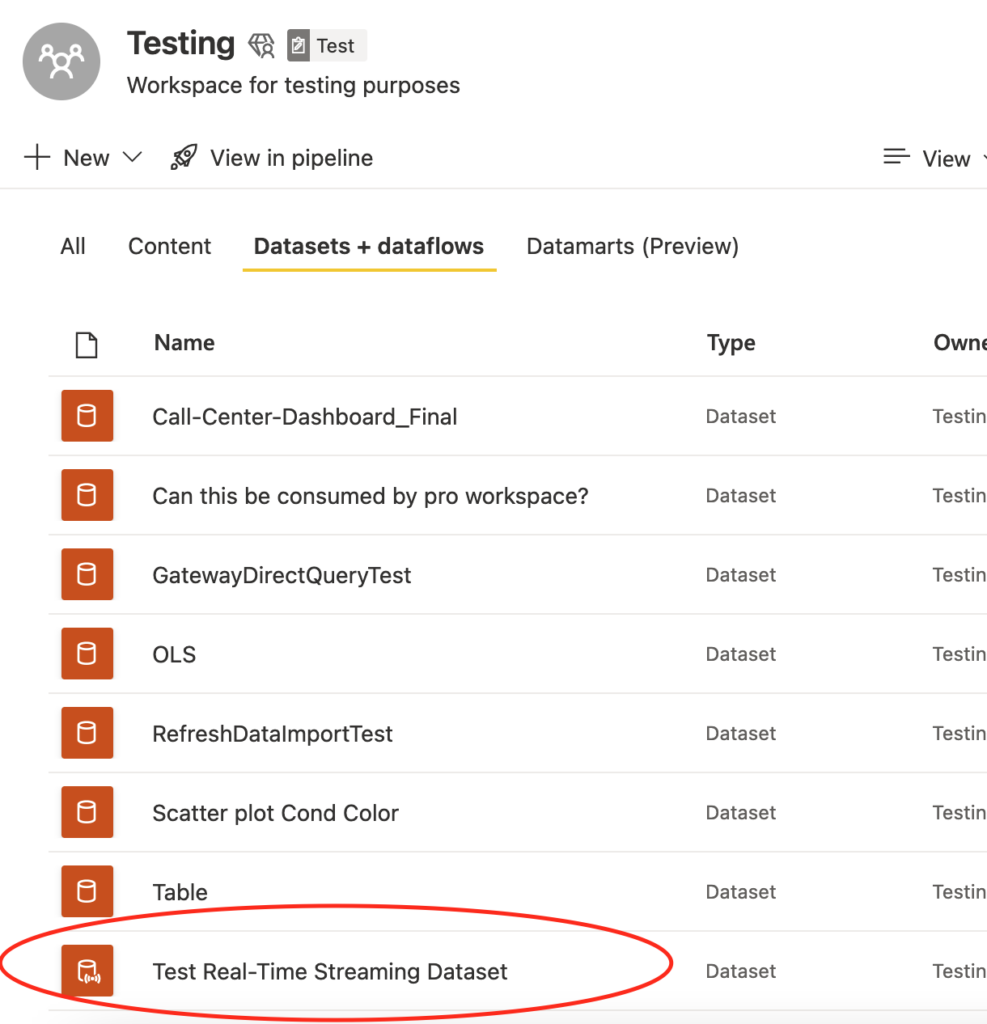
5. Then you’ll see a streaming dataset added under datasets section! Notice it has a little different icon than other datasets.
6. Now we’re ready to set up a Python script in your machine. Git clone or just copy over these resources off of this github repo. It’s a script that gets CPU/RAM information every second and send it to your push dataset until you kill/stop the program.
7. After you make sure the script is working, switch over to Power BI service again. Now you click on “Dashboard” after clicking on “+ New” button.

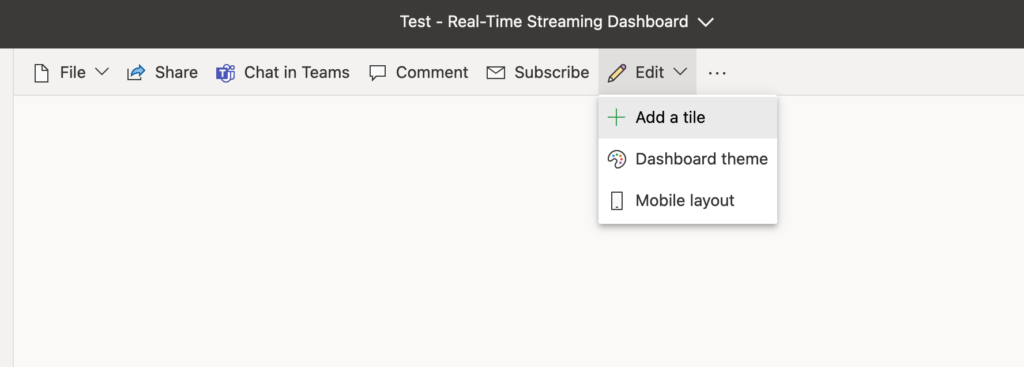
8. After you typed in your dashboard name, you’ll see a blank dashboard, where you’ll add a tile.
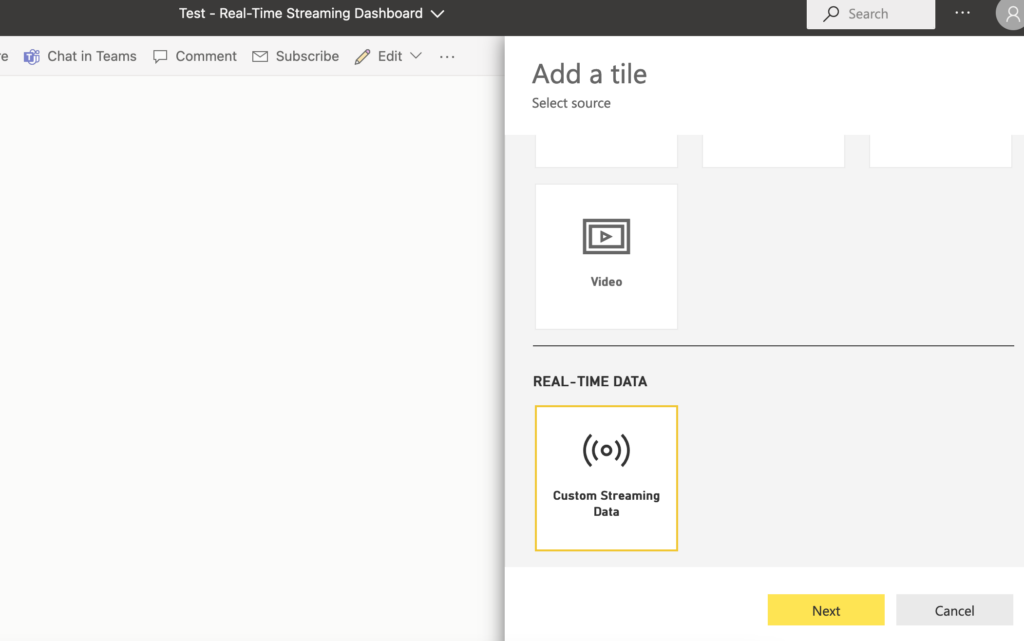
9. When you see a side window pop up, as you scroll down, you find the option for real-time streaming data. Click on it and proceed to next.
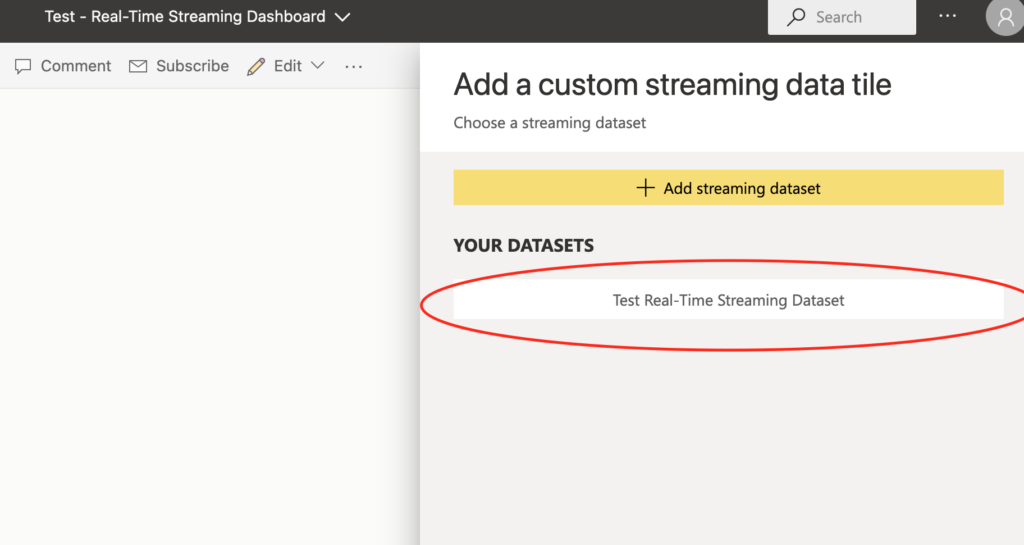
10. Then you should see the push dataset you added. Make sure to select that to proceed. As you can see, you could add a push dataset from here as well.
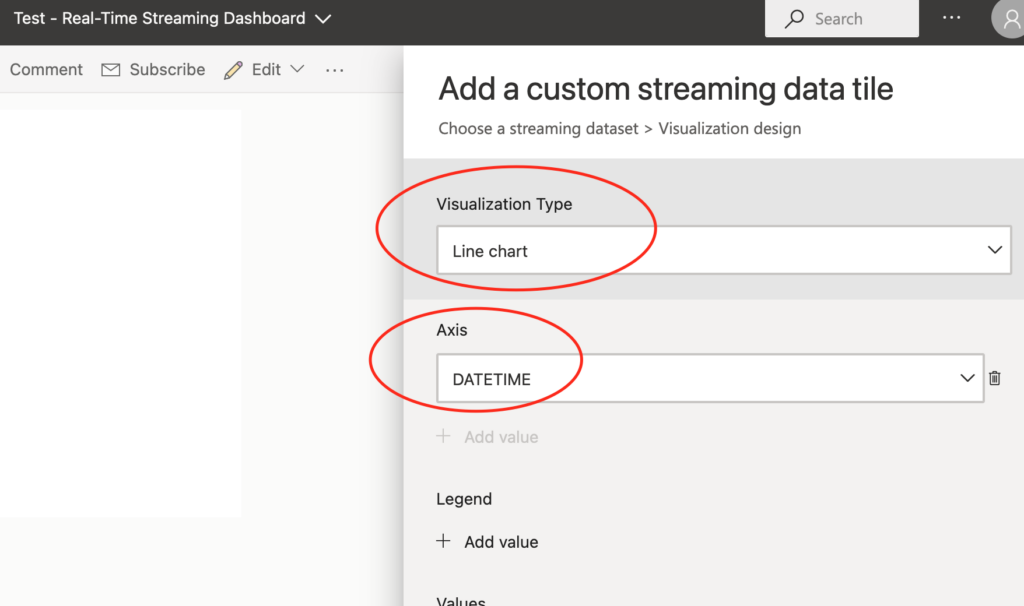
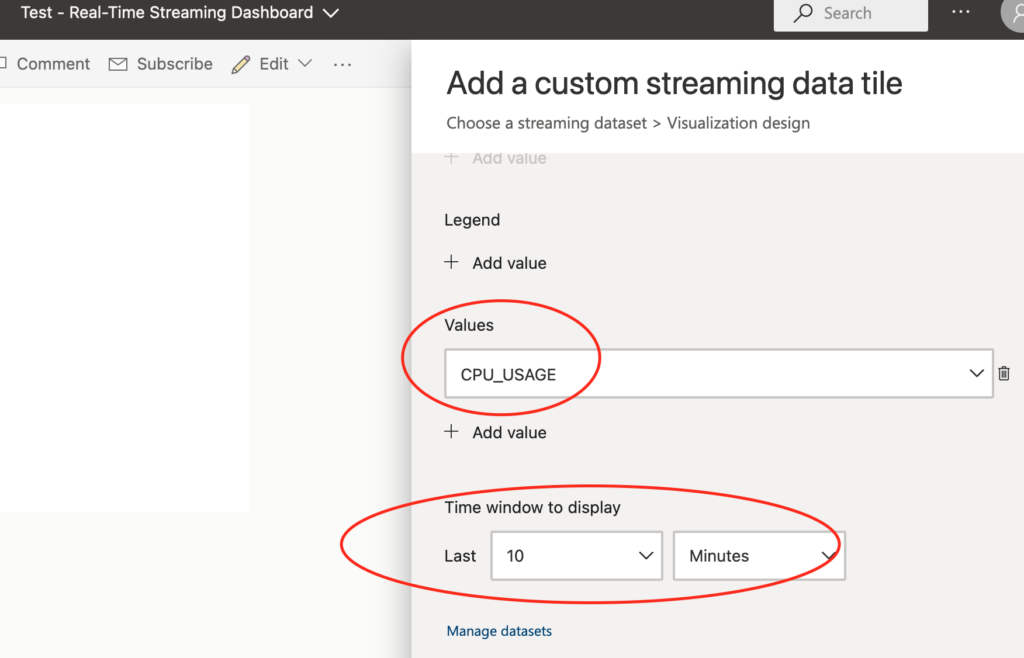
11. Here, you add the visualization type you want (line chart for this tutorial) and assign appropriate columns to each axis. For a line chart, make sure to select the time window you need.
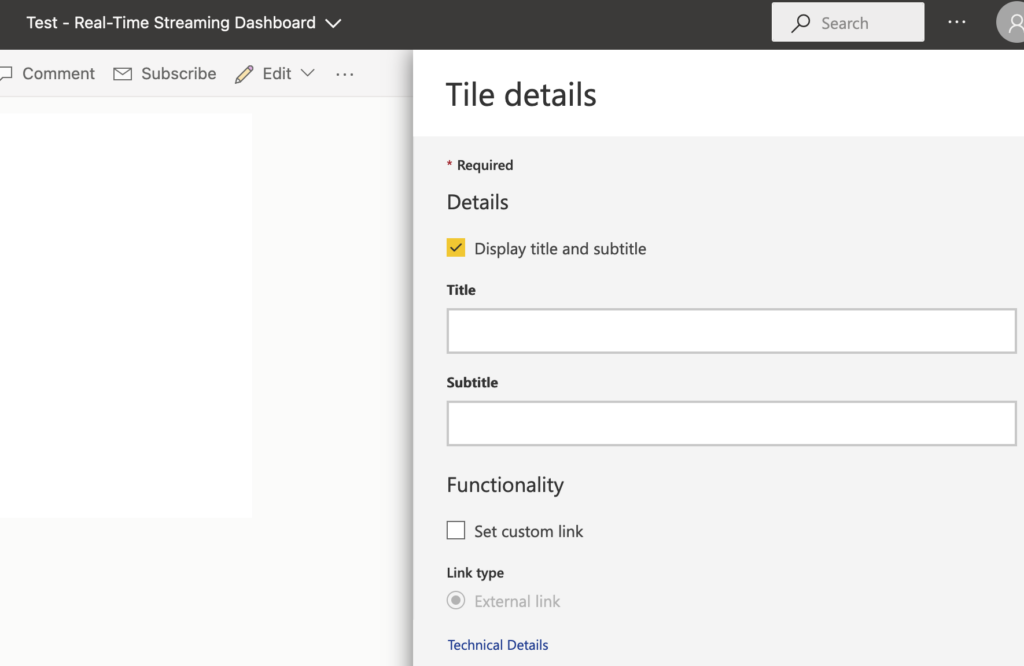
12. You get to set values for title, subtitle, etc like any other dashboard tiles. This time, I’ll keep it blank and proceed to next.
13. Notice a blank new dashboard tile has been added! You don’t see the data because you haven’t pushed any data yet. You do the same for Memory usage, making sure to add “RAM_USAGE” column to y-axis.
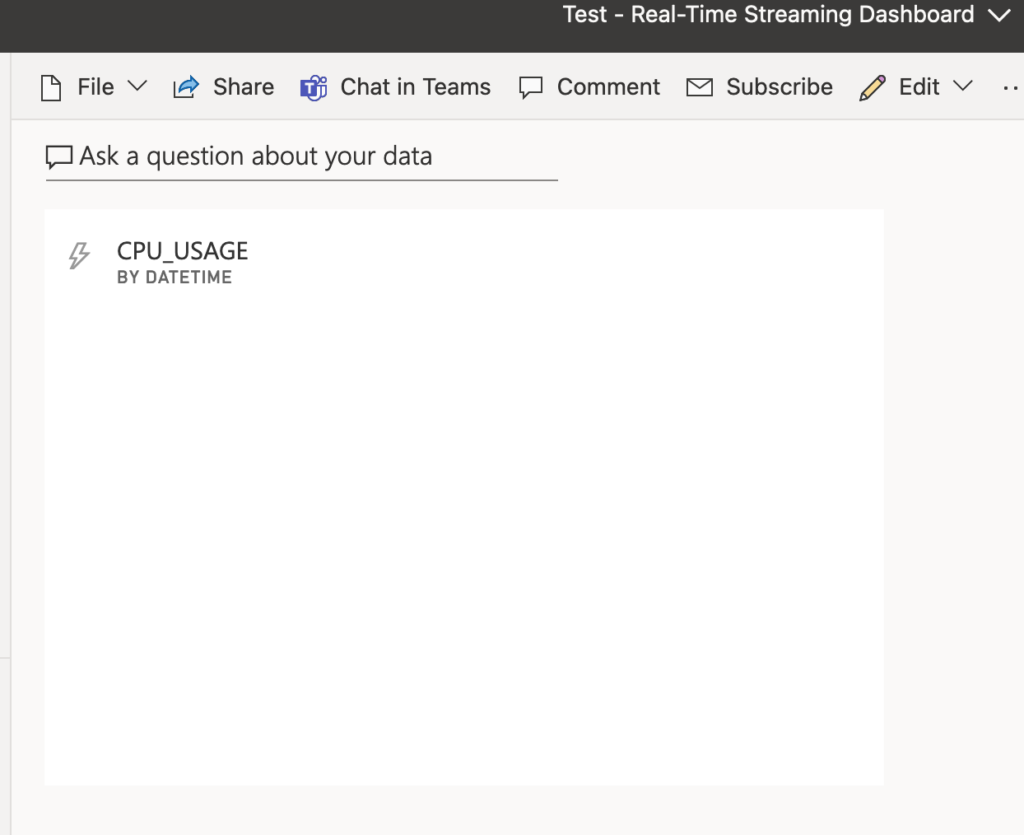
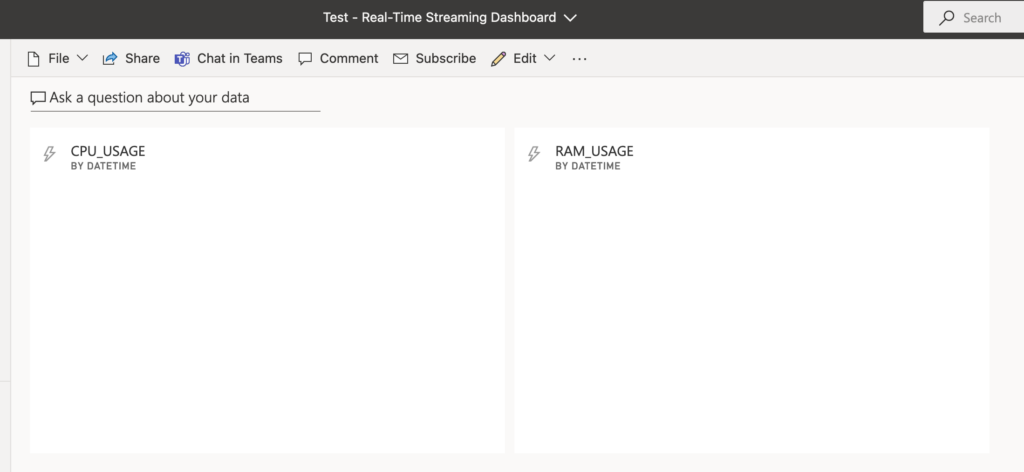
14. Now we got everything set up for a streaming dashboard, we’ll go ahead and run the Python script. You make sure your script is running, switch back over to your dashboard you just created.
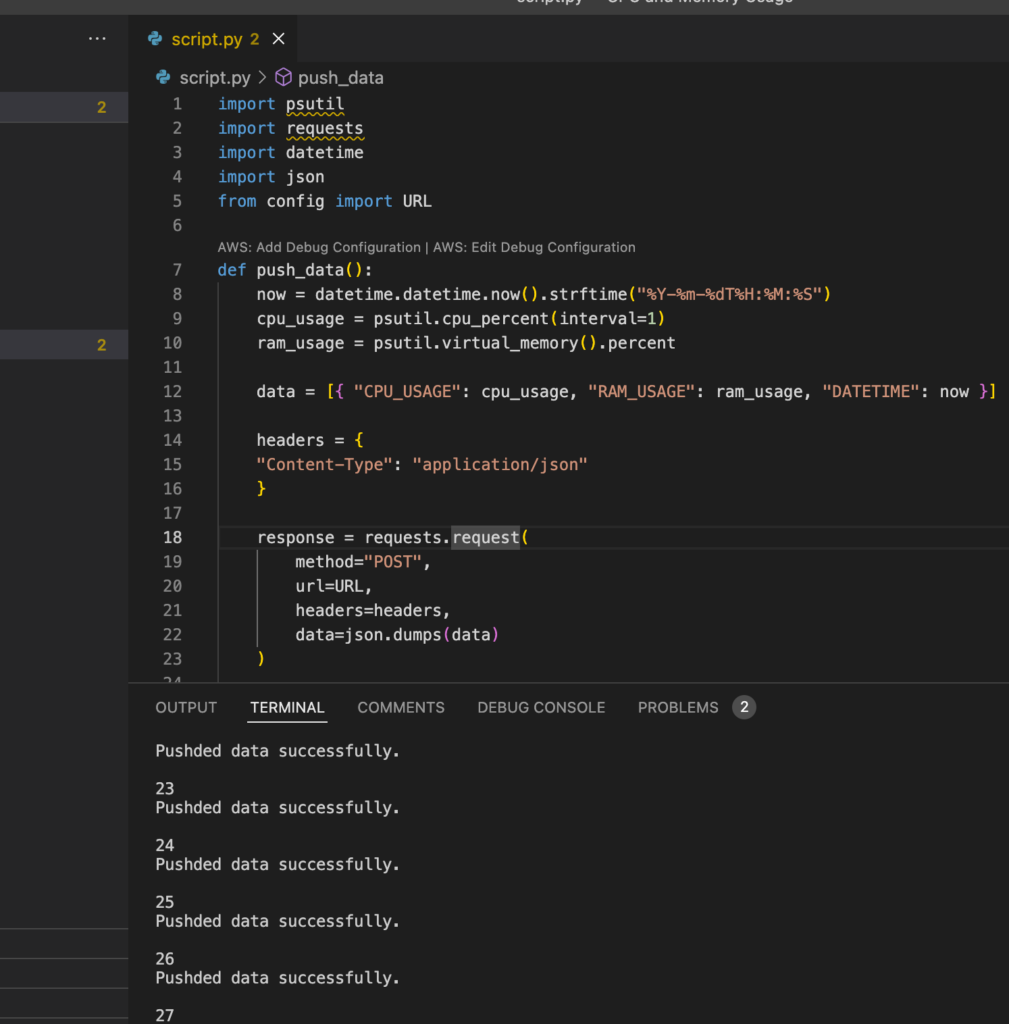
15. Now you should see your dashboard being updated every time your script pushes data to it!
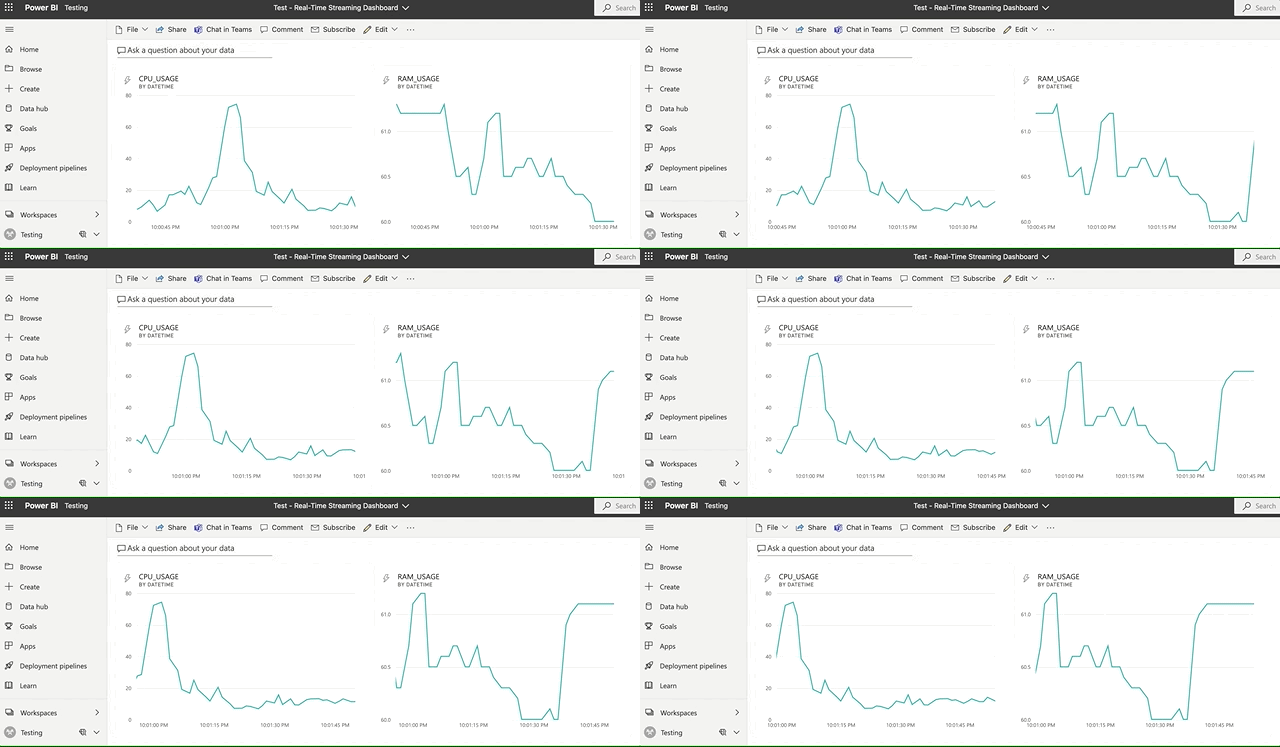
Conclusion
Once you figure it out, it’s not too hard to set up a push dataset. You can imagine how you could utilize your own API or lambda/cloud/azure functions for real-time streaming in Power BI! This streaming capability opens up a lot of doors on how to better utilize Power BI 🙂
