Pandas and Polars
Pandas is probably the most popular library for data manipulation and analysis. If you work in data, I’m sure you have heard about it or you may use it on a daily basis. Pandas is very useful and versatile in various data tasks, however, the main issue that’s being talked about is its performance.
To supplement that weakness, there appeared some other libraries such as Dask, Ray, and Modin. They help speed up your Pandas code quite a bit. Polars is one of those libraries that people say are faster than Pandas. Polars is written in Rust and fairly new in development. There is probably less documentations and resources available on Polars than that of Pandas.
There is a performance test already done comparing Polars against other popular libraries such as Pandas. Here’s the link to the test. But I wanted to test myself on my local machine so that the comparison is more relatable to the general audience.
UPDATE: Pandas 2.0 came out recently which includes Apache Arrow integration. What that means is basically Pandas now has an option to enable pyarrow, which speeds up your data wrangling workflows. I updated my performance test to include Pandas 2.0. For full disclosure, all I’m doing is to change the engine and data type backend to pyarrow when reading a csv file.
My Setup
My Laptop’s Specs
I’m using a Mac with the following specs. It’s got 500GB flash storage.

UPDATE: I upgraded my mac and I now use a 16-inch, Apple M1 Max MacBook Pro 2021 with 64GB RAM and 1TB SSD. The total number of cores is 10 (8 performance and 2 efficiency). I also use macOS Ventura.
Libraries
I’m using:
- pandas==1.5.3
- polars==0.16.2
UPDATE:
- pandas==2.0.2
- polars==0.16.2
- pyarrow==12.0.0
Data
I’m using a csv file containing 10 million rows with 14 columns, which is about 1.2GB. I used this csv data generator and the exact same command given in the command example in that github repo, with only the number of rows modified. You’d need to have node.js installed on your computer to use that data generator.
I’m also using another csv file containing the same columns with 1 million rows. I use it when I compare the performance of the join operations.
In case you’d like to generate the exact same data to test on your environment, use the following commands:
A csv file with 10 million rows:
node generator.js "email,first,last,age,street,city,state,zip,digid,date(3),latitude,longitude,pick(RED|BLUE|YELLOW|GREEN|WHITE),string" 10000000 10million.csv
A csv file with 1 million rows:
node generator.js "email,first,last,age,street,city,state,zip,digid,date(3),latitude,longitude,pick(RED|BLUE|YELLOW|GREEN|WHITE),string" 1000000 1million.csv
After having generated csv files, I added the column header manually with the following names:
email,first,last,age,street,city,state,zip,digid,date,latitude,longitude,pick,stringRead a CSV File
Performance

Polars read a csv file about 10 times faster than Pandas.
UPDATE:

Pandas with Arrow actually beat Polars performance. They’re very close though. Pandas is still slow but now my laptop has better specs, that helped speed up the execution time by a lot. Both Polars and Pandas with Arrow are about 20 times faster than Pandas.
Code
Polars:
def read_polars(file_path):
    '''
    Read a csv with polars
    '''
    df = pl.scan_csv(file_path).collect()
    return df
Pandas:
def read_pandas(file_path, engine=None, dtype_backend='numpy_nullable'):
    '''
    Read a csv file with pandas
    '''
    df = pd.read_csv(file_path, engine=engine, dtype_backend=dtype_backend)
    return df
Simple Aggregations with Groupby
Now we’ll test simple aggregations such as sum and average with groupby.
Performance

Polars is about 3 times faster.
UPDATE:
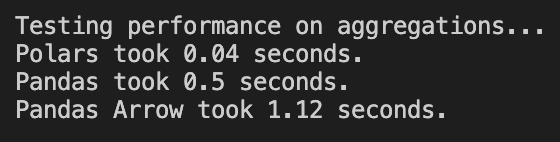
Polars beat both Pandas and Pandas with Arrow by a lot. Not sure why Pandas with Arrow took twice longer than Pandas. Polars is 10 times faster than Pandas.
Code
Polars:
def agg_polars(pl_df):
    '''
    take a polars df and execute a few aggregate functions
    '''
    q = (
        pl_df.lazy()
        .groupby("state")
        .agg(
            [
                pl.count().alias('cnt'),
                pl.col("age").mean().alias('mean age'),
                pl.col("age").min().alias('min age'),
                pl.col("age").max().alias('max age')
            ]
        )
        .sort("state")
    )

    output = q.collect()

    return output
Pandas:
def agg_pandas(pd_df):
    '''
    take a pandas df and execute a few aggregate functions
    '''
    output = (
        pd_df
        .groupby('state')['age']
        .agg(
            ['count', 'mean', 'min', 'max'],
        )
        .sort_values(by=['state'])
    )

    return output
Window Functions
I added two columns. One is average age over state and another one is age rank within each state.
Performance
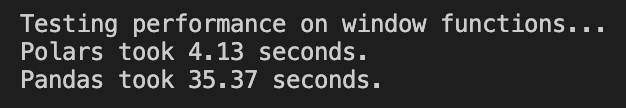
Polars is about 8 times faster.
UPDATE:
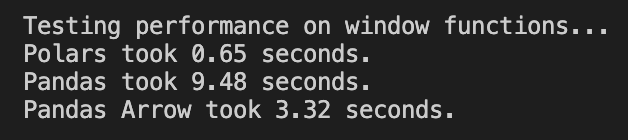
I changed one thing on this test. I removed a window function because “rank” was not compatible with Arrow integration.
Polars is the fastest, but Pandas with Arrow beats Pandas. Polars is about 5 times faster than Pandas with Arrow, and Pandas with Arrow is 3 times faster than Pandas.
Code
Polars:
def window_func_polars(pl_df):
    '''
    new column 1 - avg age per state
    new column 2 - age rank within each state
    '''
    q = (
        pl_df.lazy()
        .select(
            [
                'email',
                'first',
                'last',
                'state',
                'age'
            ]
        )
        .with_columns([
            pl.col('age').mean().over('state').alias('avg_age_per_state'),
            # pl.col('age').rank(method='dense').over('state').alias('age_rank')
        ])
        .sort('state')
    )

    output = q.collect()

    return output
Pandas:
def window_func_pandas(pd_df):
    '''
    new column 1 - avg age per state
    new column 2 - age rank within each state
    '''
    output = (
        pd_df
        .loc[:, ['email', 'first', 'last', 'state', 'age']]
        .assign(avg_age_per_state=lambda df: df.groupby('state')['age'].transform('mean'))
        # .assign(age_rank=lambda df: df.groupby('state')['age'].rank(method='dense'))
        .sort_values(by=['state'])
    )

    return output
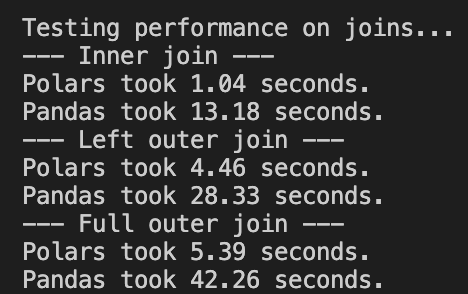
Join Operations
I chose commonly used join operations, which are inner join, left join, and full outer join.
Performance
Inner join: Polars is about 12 times faster
Left join: Polars is about 6 times faster
Full outer join: Polars is about 7 times faster
UPDATE:
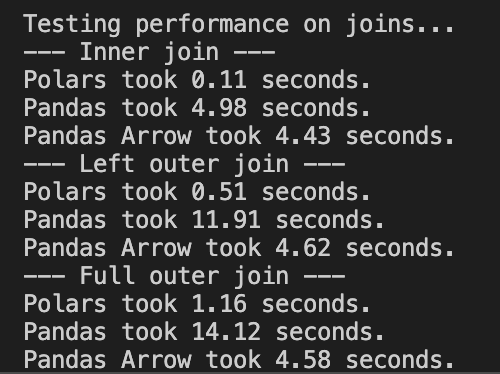
Inner join: Pandas with Arrow and Pandas are pretty much the same speed. Polars beat them by 40x the speed.
Left join: Polars is about 9 times faster than Pandas with Arrow, and Pandas with Arrow is about 3 times faster than Pandas.
Full outer join: Polars is about 4 times faster than Pandas with Arrow, and Pandas with Arrow is about 3 times faster than Pandas.
Code
Polars:
def join_polars(pl_df1, pl_df2, on_column, join_type):
    '''
    a func to join in polars based on inputs
    '''
    output = pl_df1.lazy().join(pl_df2.lazy(), on=on_column, how=join_type).collect()
    return output
Pandas:
def join_pandas(pd_df1, pd_df2, on_column, join_type):
    '''
    a func to join in pandas based on inputs
    '''
    output = pd_df1.merge(pd_df2, on=on_column, how=join_type)
    return output
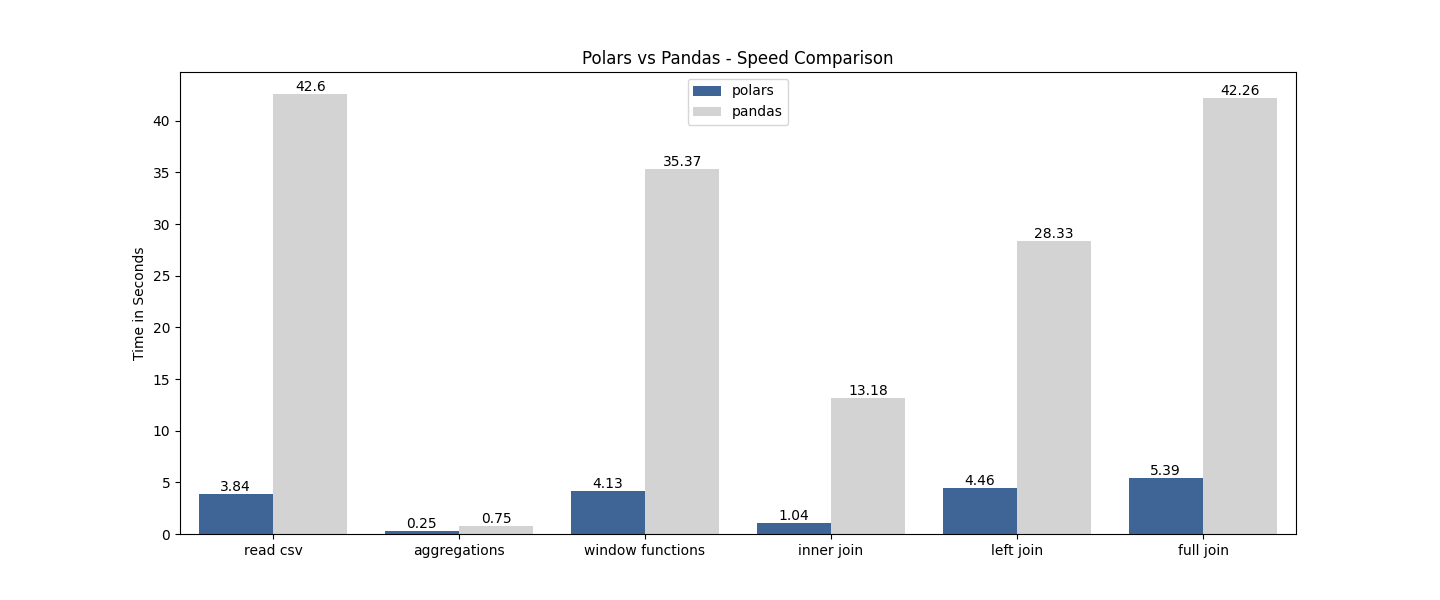
Visualizing the Result
UPDATED:
Limitations
First of all, this is not at all an official performance testing for Polars and Pandas.
I didn’t purposely choose the complexity of the data and data format (csv). I chose 10 million rows because that’s about the size where I could say data is big enough and that it’s not small. I chose csv format because it was easy to generate. I can see that if the dataset was a lot smaller, Pandas would be comparable to Polars.
I didn’t consider things like how many tabs in a browser were open, how many software I was running, my internet speed, etc, which may or may not have affected my performance test.
Another thing worth mentioning is that I may or may not have used the most optimal way of doing things both in Polars and Pandas, due to my lack of expertise in each library.
UPDATE: I updated this performance test to include Pandas 2.0 with Apache Arrow backend, I had to remove one of the window functions because rank() is not compatible Arrow data types. This doesn’t have to do with much of the performance test itself, but I thought it’d be worth noting.
Conclusion
Given the limitations I listed, I still consider Polars a strong alternative to Pandas library (which may be obvious to many of you without my testing!). I’d probably start using Polars more where possible for performance reasons, though, I can definitely see cases when Pandas is more appropriate depending on the project. If Pandas is the only option, looking into using Arrow integration is the way to go, though, there seems to be some limitations on what transformations can be used.
Source code: Github repo
Hello this is nice, pls can u compare the same on the new Pandas 2.0 with PyArrow back end instead of Numpy.
That’s on my list!