Menu
Stuff by Yuki
  • Home
  • Data Engineering
    • Python
  • Business Intelligence
    • Power BI
    • Tableau
  • Perspectives
  • About
  • Contact
Stuff by Yuki

What Animal Could You Beat in a Fight?

Posted on May 21, 2021July 28, 2021

MoM 2021 Week20 – Power BI

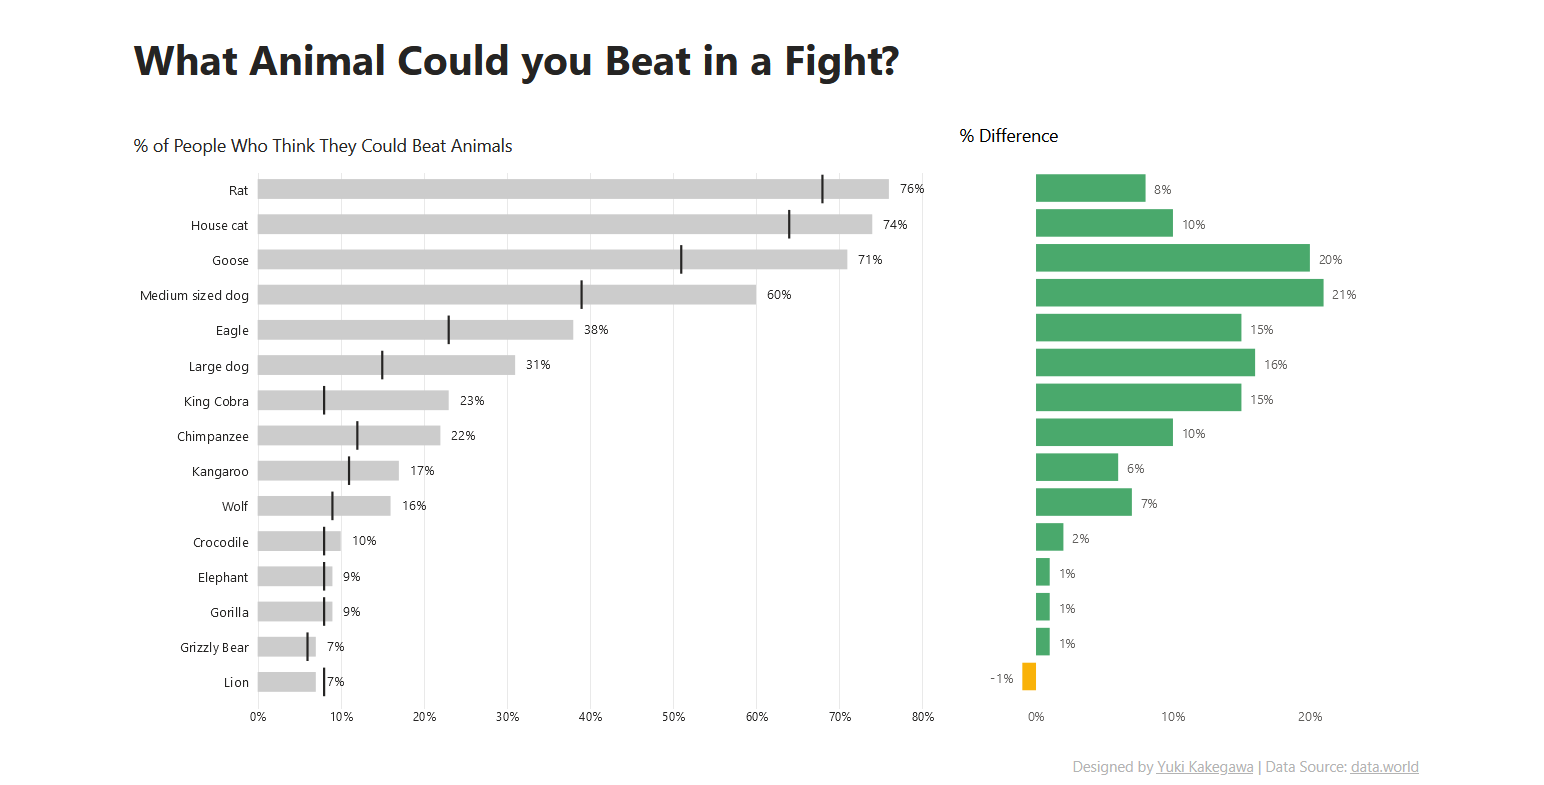
I got to work on the data showing how women/men think they could beat animals with bear hand!

My viz choice was a bullet chart and a bar chart. It’s pretty easy to create a bullet chart in Tableau, but there is not default viz for it in Power BI so I needed to import a custom visual. And that’s one thing that’s amazing about Power BI is that custom visuals are open source, whoever wants to contribute can create visuals on their own!

I didn’t use much of complicated measures or anything, but here’s some code I used to change the color depending on some value:

Conditional Color = 
var _diff = [Male - Female]
RETURN
IF( _diff < 0, "#f9b208",
    // else
    "#4aa96c")

Data Source | Source Code

Leave a Reply Cancel reply

Your email address will not be published. Required fields are marked *

Recent Posts

  • Where I’m Headed in the Next 5 Years
  • Open-Source vs Vendor Data Tools
  • Developing the Habit of Writing
  • How to Inspect and Optimize Query Plans in Python Polars
  • Learn Python Polars with Polars Cookbook

Popular Posts

  • A Running Total Calculation with Quick Measure in Power BI
  • A Complete Guide to Git Integration in Power BI
  • How To Copy And Paste Report Page in Power BI
  • Handling Missing Values in Polars
  • How to Convert String to Date or Datetime in Polars

connect with me

  • LinkedIn
  • Twitter
  • Github
  • Website

Search Articles

©2025 Stuff by Yuki | Powered by SuperbThemes