Menu
Stuff by Yuki
  • Home
  • Data Engineering
    • Python
  • Business Intelligence
    • Power BI
    • Tableau
  • Perspectives
  • About
  • Contact
Stuff by Yuki

How Do You Create DAX Tables?

Posted on May 19, 2021July 28, 2021

WoW 2021 Week20 – Power BI

Workout Wednesday exercises are always great! This time I created tables utilizing DAX SUMARRIZE function. I didn’t have much experience with that function prior, but it seems pretty straight forward.

CALCULATE function comes in to play for a lot of cases.

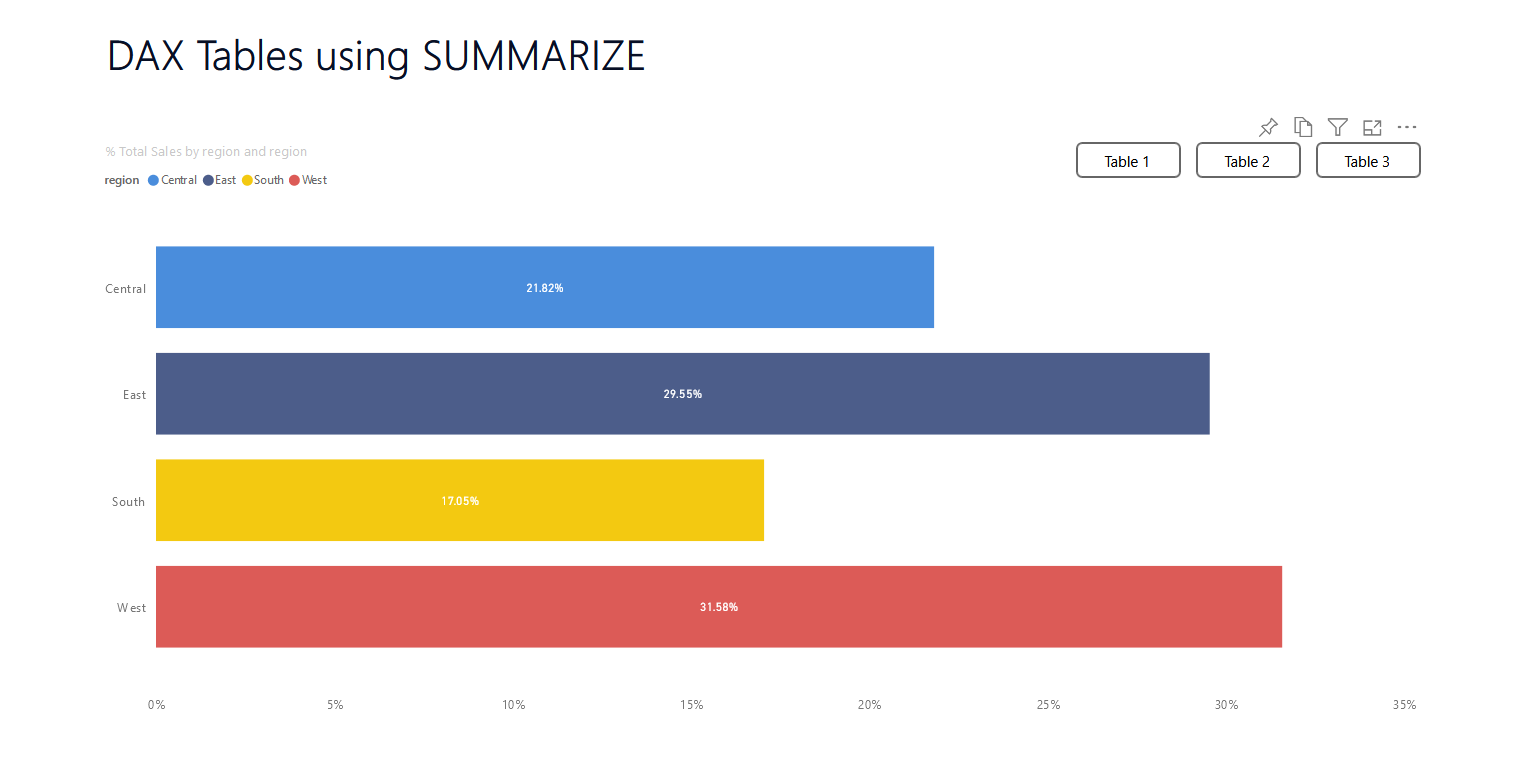
Here is some code I created to get the percentage sales for each year so as to using it in a bar chart showing the percentage by region.

Total Sales - DAX Table 2 = CALCULATE( [Sum of Sales], ALLEXCEPT( orders, orders[Year] ))
DAX Table 2 = SUMMARIZE (
        orders,
        orders[Year],
        orders[region],
        "Sales", [Sum of Sales],
        "Total Sales", [Total Sales - DAX Table 2],
        "% Total Sales",
            DIVIDE (
                [Sum of Sales],
                [Total Sales - DAX Table 2]
    ))

DAX is really flexible in that you can adjust it depending on how you need to show your data. The more you work with DAX, the better you understand how it works in each case!
Data Source | Source Code

Leave a Reply Cancel reply

Your email address will not be published. Required fields are marked *

Recent Posts

  • Where I’m Headed in the Next 5 Years
  • Open-Source vs Vendor Data Tools
  • Developing the Habit of Writing
  • How to Inspect and Optimize Query Plans in Python Polars
  • Learn Python Polars with Polars Cookbook

Popular Posts

  • A Running Total Calculation with Quick Measure in Power BI
  • A Complete Guide to Git Integration in Power BI
  • How To Copy And Paste Report Page in Power BI
  • Handling Missing Values in Polars
  • How to Convert String to Date or Datetime in Polars

connect with me

  • LinkedIn
  • Twitter
  • Github
  • Website

Search Articles

©2025 Stuff by Yuki | Powered by SuperbThemes