What does it mean by “Semi-Additive”?
In order to understand the concept of semi-additive measures, you need to understand what fully-additive measures are. A good example of a fully-additive measure is “Sales” in a sales table. It can be summed or aggregated across any dimension/field such as “Date”, “Product”, or “Store”. A fully-additive measure is a measure that can be aggregated across any dimension.
Then what is a semi-additive measure? You might have a good guess at this point already, but it’s a measure that can be aggregated across some dimensions but cannot be aggregated across some other dimensions. A good example that I’ll be using in this post is “Salary”. You won’t aggregate it over “Day” because an employee/person typically has their fixed salary for the year. But you can aggregate across all the “employees”.
There is actually another type of measure, which is called non-additive measures. It’s essentially a measure we can’t aggregate over any dimension/field. I won’t go into explaining it in depth in this post.
How to Aggregate Semi-Additive Measures in DAX
If you look at the table below, you can see that the grain of the table is “per person per team”. One person can belong to more than a team. Thus, “Salary” is duplicated if a person has more than one team.
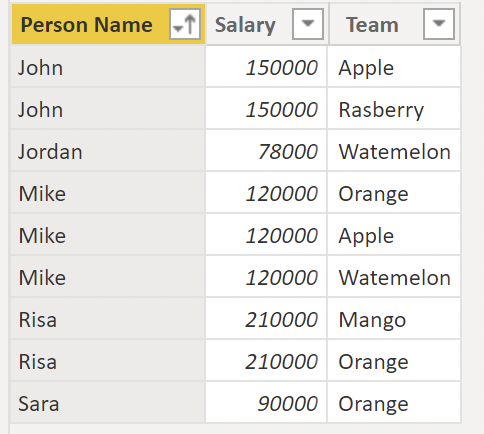
You may be already seeing this, but if you simply sum across these records, the result would be wrong, which I demonstrate below.
Calculate the Sum of Semi-Additive Measures
Let’s try calculate the sum of Salary over this table.
Measure definition:

Result:
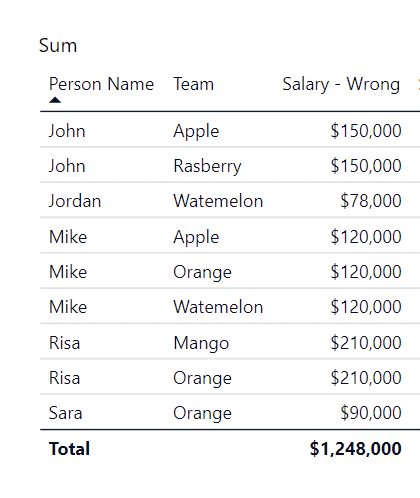
Looking at the total, it is obviously wrong. They are not considering duplicated values, meaning they’re over-summing the salary of those who belongs to more than one team. If we calculate the sum of salaries for unique persons, then the result should be $150,000 + $78,000 + $120,000 + $210,000 + $90,000 = $648,000.
Some might say that you need to use MIN() or MAX() to avoid summing across duplicated values, but that still gives you a wrong result:
Measure definition:

Result:
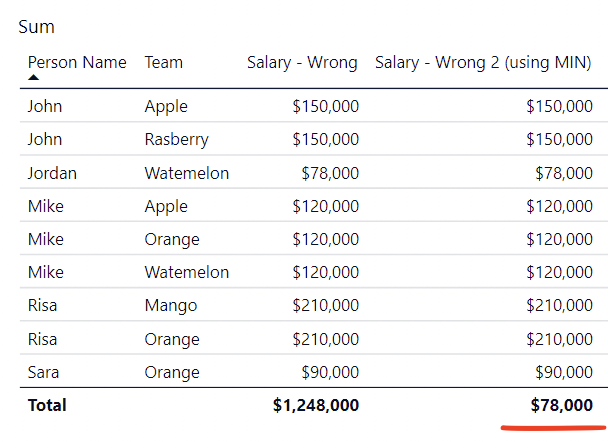
Notice that individual row is correct again. The total is still wrong. It’s just getting the minimum of all values. But this is one step forward than simple SUM().
Using MIN() or MAX() is a good idea because we can use SUMX() with it. And that’s actually how we get to the correct solution here.
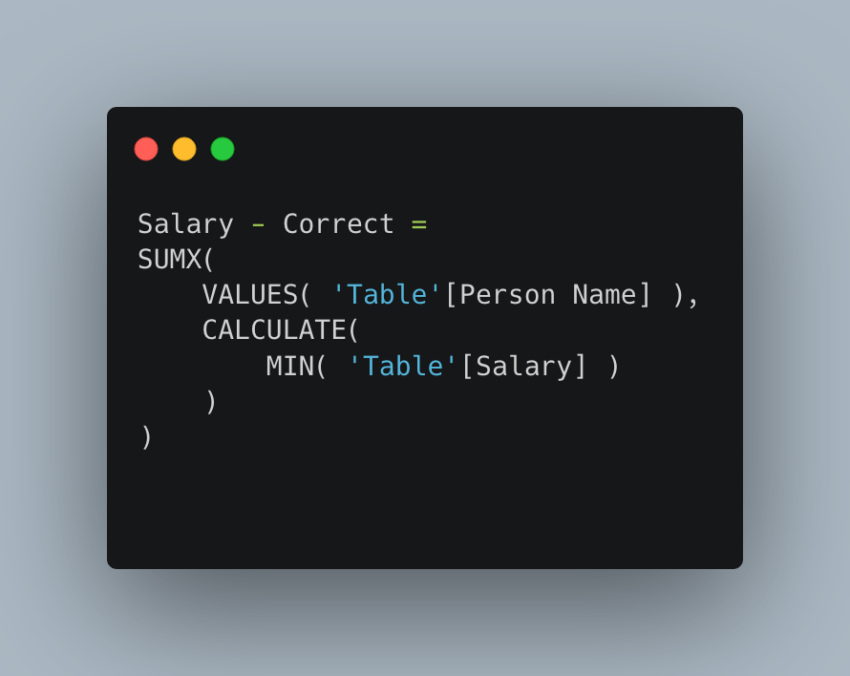
What does the correct DAX measure look like?
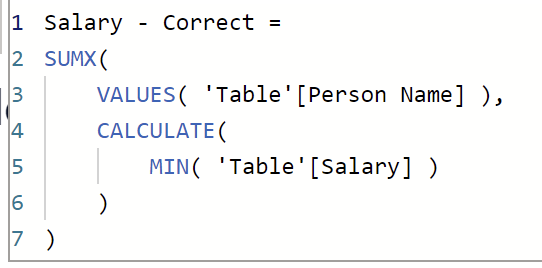
Salary - Correct =
SUMX(
    VALUES( 'Table'[Person Name] ),
    CALCULATE(
        MIN( 'Table'[Salary] )
    )
)
Why did I used SUMX()? Let’s break down the code a bit as it involves a few important DAX concepts.
SUMX() is an iterator, meaning that it iterates or goes through a table row by row. The arguments you can define are table and expression. Whenever you use this function, it will look like this SUMX( YourTable, YourExpression).
In my case, for “table” argument, I’m passing in VALUES() function. It returns a unique values of a column in a table (Note that it returns a table with that column being only one attribute in it). So it’s still a table but it just contains only one column.
Because I’m taking unique persons from a table, SUMX() iterates through those unique values instead of all the values that exist in the table.
For “expression” argument, I’m trying to get, it uses CALCULATE() to utilize context transition. It’s an advanced concept, which I’m not going to explain in detail here, but simply put, context transition changes row context into filter context. And that’s how you get correct values even though you’re passing in MIN() for each person/row.
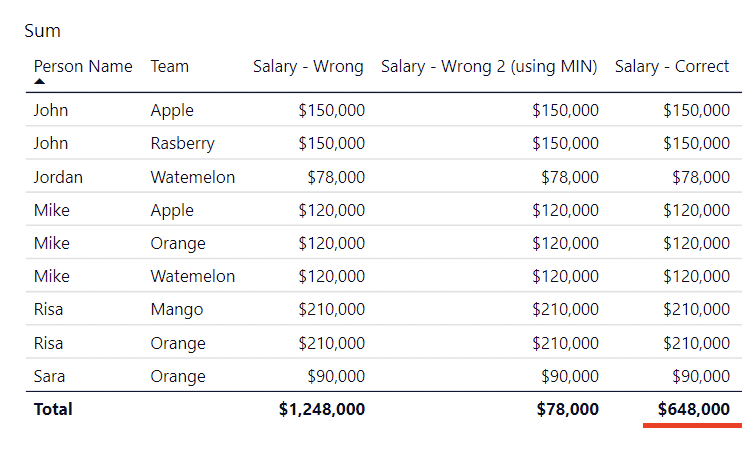
If you calculate on a calculator, $648,000 is the correct value.
Calculate the Average of Semi-Additive Measures
It’s easy to calculate the average as we already have the logic and we’d just need to change it to AVERAGEX().
AVERAGEX() is an iterator that averages values of your specified expression over the table you pass in. The DAX code looks like this:
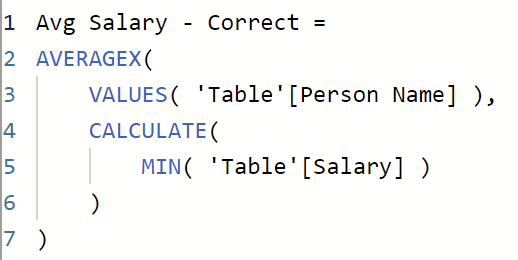
Avg Salary - Correct =
AVERAGEX(
    VALUES( 'Table'[Person Name] ),
    CALCULATE(
        MIN( 'Table'[Salary] )
    )
)
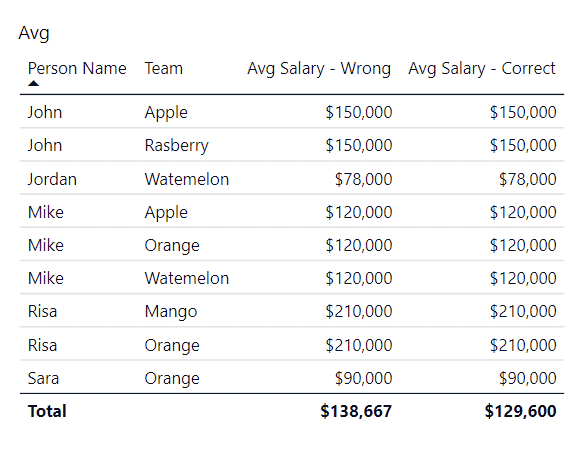
And the output would be the following. “Avg Salary – Wrong” measure is just a simple average. ($150,000 + $78,000 + $120,000 + $210,000 + $90,000) / number of unique persons = $129,600.
Conclusion
Iterator functions such as SUMX() and AVERAGEX() are very useful. Once you understand how they work in conjunction with context transition, you’ll be able to do a lot more in DAX. And that’s one way to aggregate semi-additive measures.
The Power BI file I used is found in this github repo.