What is an Information Panel?
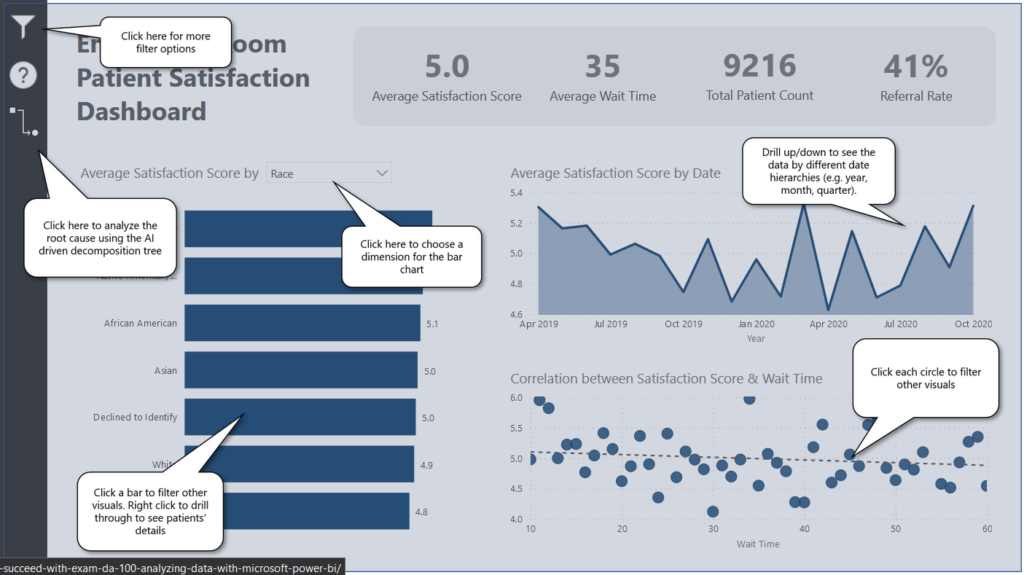
An information panel is an image overlay for your data dashboard / report explaining what the user can do with it. I learned about the use of information panel from a Guy in a cube YouTube video. They make great videos!
As a developer, there may be cases where the end-users are not tech savvy or they are not as familiar with how to navigate your visualizations. And this is where information panel comes into play. You literally add an additional layer in your dashboard explaining whatever you think your end-users should know.
This is one example of when the user opens an information panel in a dashboard:
Creating an Information Panel with PowerPoint
Now the question is, “How do I create an information panel?”. The process is rather simple! I use PowerPoint for this task, which Guy in a cube also used in their video. But you can use whatever the tool you have if it can accomplish what I’ll demonstrate here.
Here are the steps:
- Take a screenshot of your complete dashboard / report.
- Paste that image into a PowerPoint slide (size of a PowerPoint slide is 16:9 by default, need to adjust otherwise).
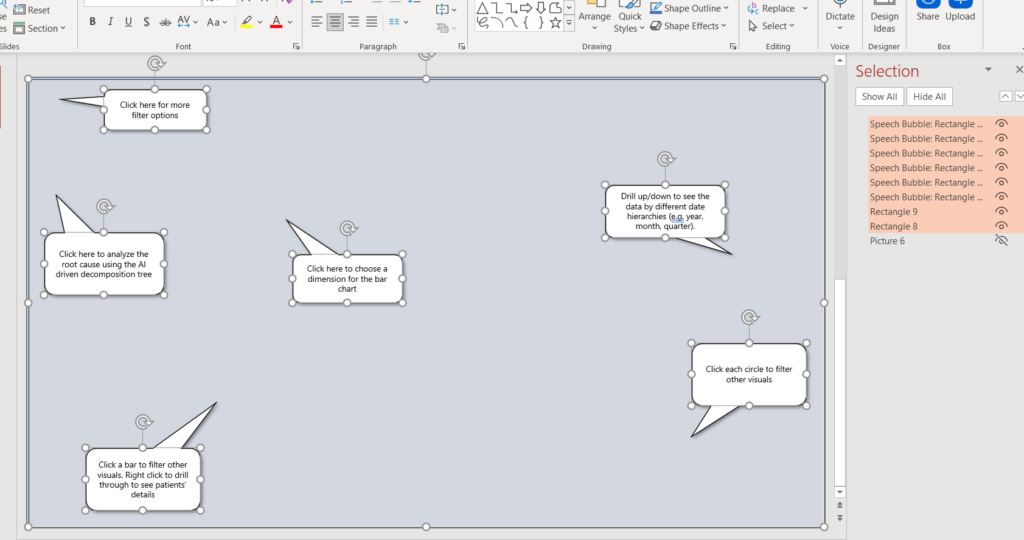
- Add a shape (adjust color transparency) covers the whole image you pasted, and add bubbles with descriptive texts for your visuals.
- Hide or delete the image you first pasted.
- Save what you made by selecting all the elements with Ctrl + A (by selecting elements, you save the whole thing as a transparent image). Right click and save it as png.
- Add a button with bookmark on which if the user click, the information panel appears.
Here are steps with images:
- Take a screenshot of your complete dashboard / report.
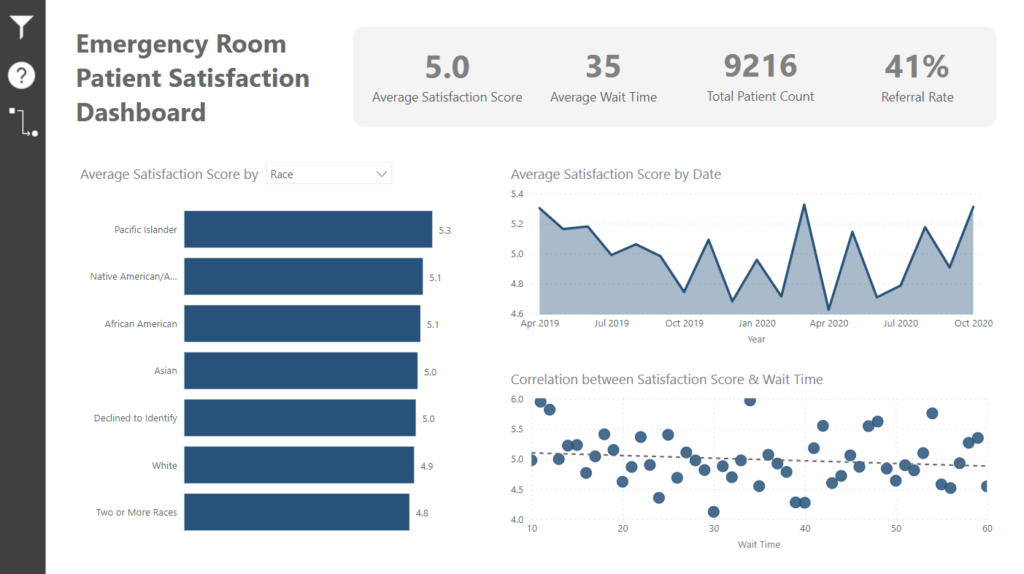
2. Paste that image into a PowerPoint slide (size of a PowerPoint slide is 16:9 by default, need to adjust otherwise).
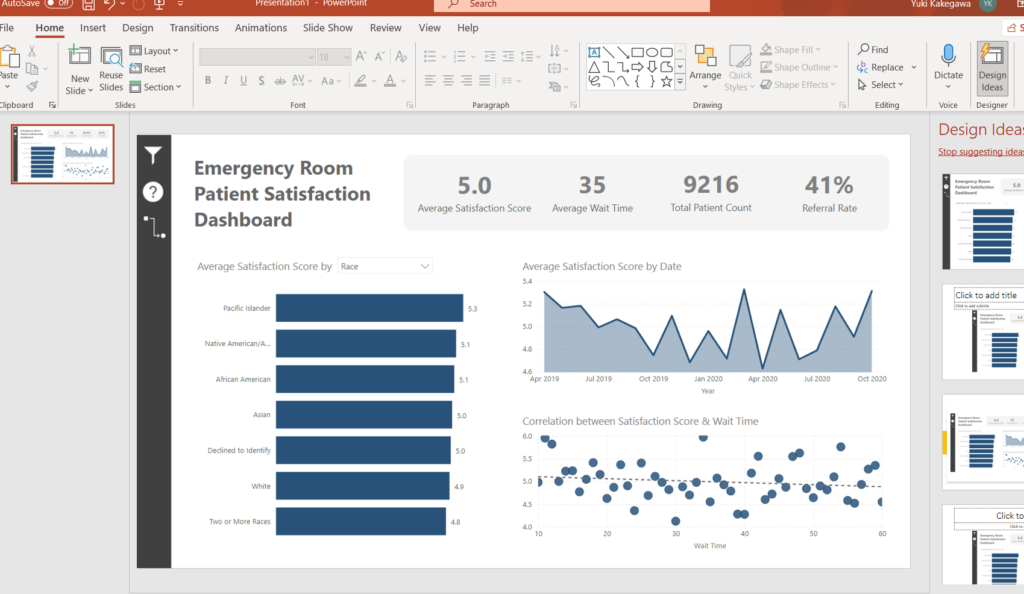
3. Add a shape (adjust color transparency) covers the whole image you pasted, and add bubbles with descriptive texts for your visuals.
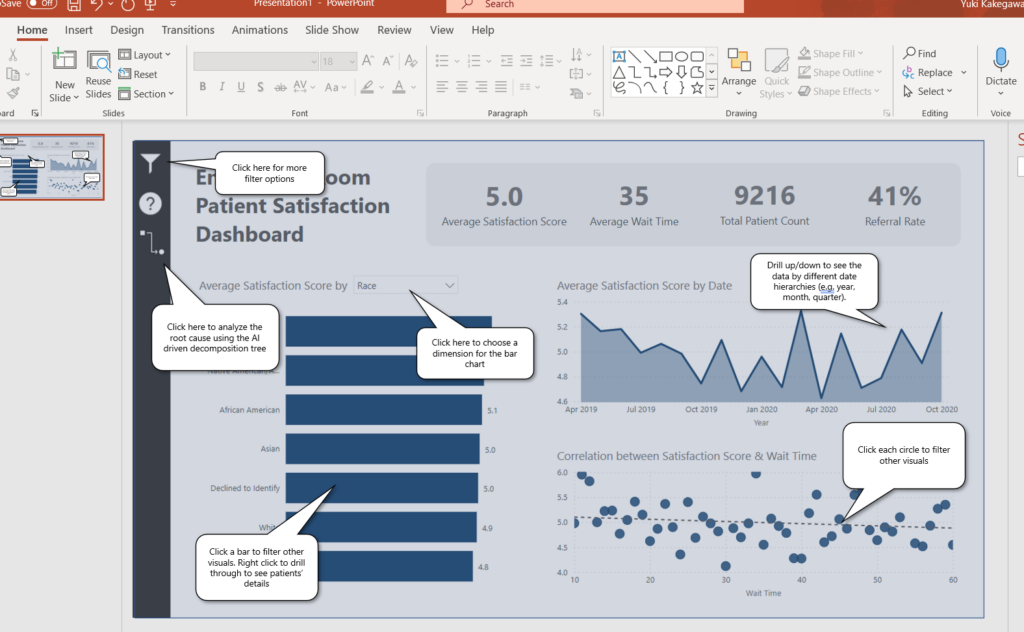
4. Hide or delete the image you first pasted.

5. Save what you made by selecting all the elements with Ctrl + A (by selecting elements, you save the whole thing as a transparent image). Right click and save it as png.
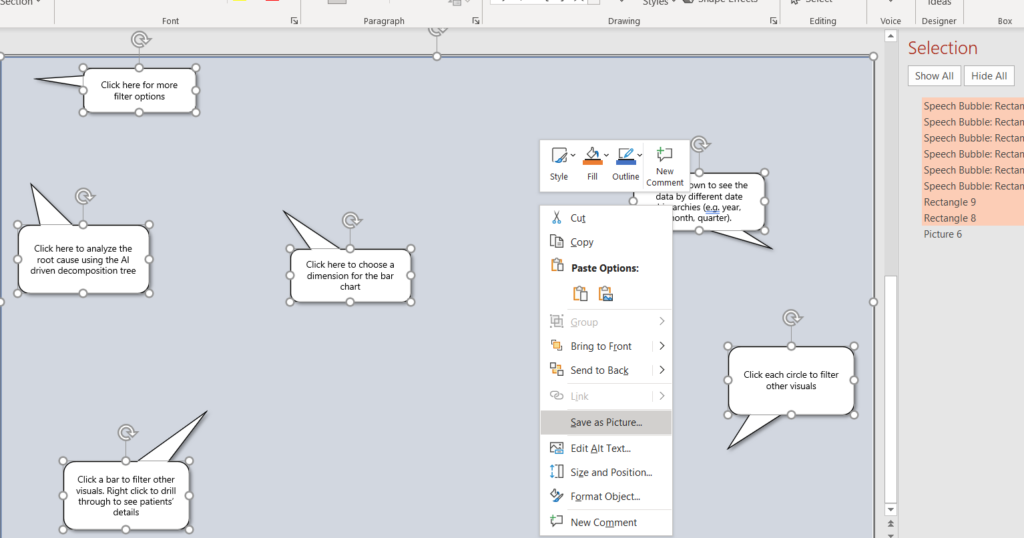
6. Add your image in Power BI and a button with bookmark on which if the user click, the information panel appears.
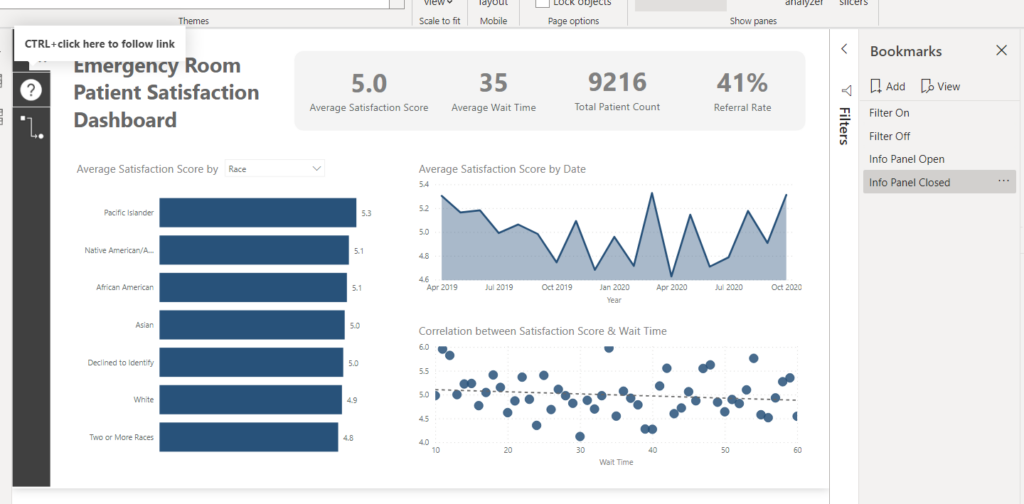
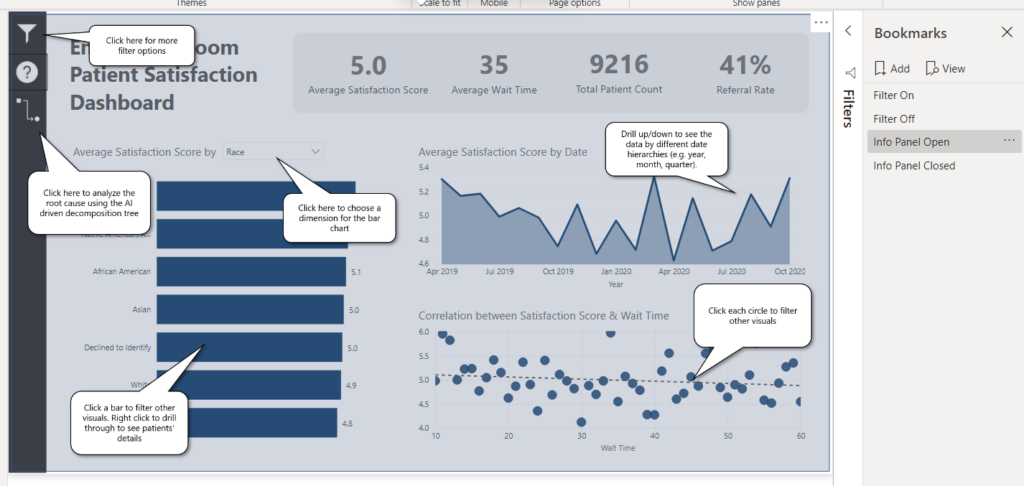
Now that you created your information panel, your user will have better experience with your visualizations!
If you prefer watching a video, there is a Guy in a cube YouTube video on how to create an information panel 👍
