WoW 2021 Week20 – Power BI
Workout Wednesday exercises are always great! This time I created tables utilizing DAX SUMARRIZE function. I didn’t have much experience with that function prior, but it seems pretty straight forward.
CALCULATE function comes in to play for a lot of cases.
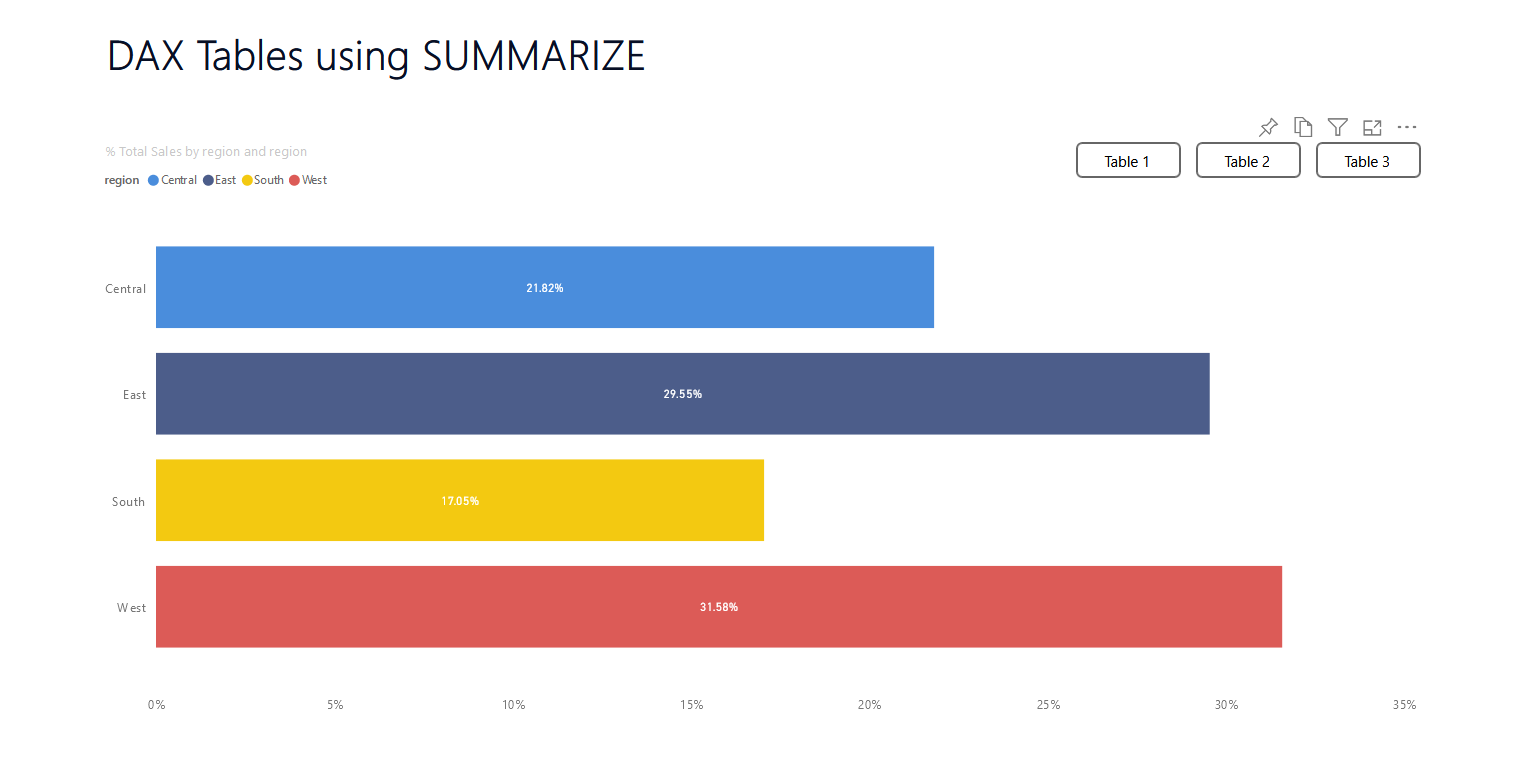
Here is some code I created to get the percentage sales for each year so as to using it in a bar chart showing the percentage by region.
Total Sales - DAX Table 2 = CALCULATE( [Sum of Sales], ALLEXCEPT( orders, orders[Year] ))DAX Table 2 = SUMMARIZE (
orders,
orders[Year],
orders[region],
"Sales", [Sum of Sales],
"Total Sales", [Total Sales - DAX Table 2],
"% Total Sales",
DIVIDE (
[Sum of Sales],
[Total Sales - DAX Table 2]
))DAX is really flexible in that you can adjust it depending on how you need to show your data. The more you work with DAX, the better you understand how it works in each case!
