Calculate Average Sales Per Customer in a DAX Measure
In any business intelligence tool, there is a need to calculate the average of a metric per data grain like customer or user. To many Power BI users, it’s not as intuitive as creating a simple measure calculating the average of sales.
In this blog post, I’ll go through the creation of a DAX measure to calculate average sales per customer, which can be applied to some other situations like average sales per user or average sales per day, for example. It’s different than the calculation of average we typically use. Average sales per customer essentially shows you how much each customer spent on average. This could be used to show the average amount a customer spent on a specific product, etc.
How To Calculate Average Sales Per Customer
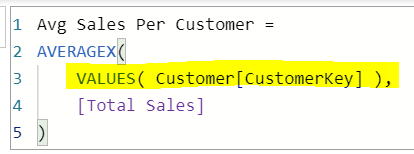
The key functions to make this DAX measure possible are VALUES and AVERAGEX. Jumping to the point, here’s the DAX code that accomplishes what we want:
Avg Sales Per Customer =
AVERAGEX(
    VALUES( Customer[CustomerKey] ),
    [Sales]
)
VALUES function is getting you unique/distinct customers. AVERAGEX function is different from typical AVERAGE function in that AVERAGEX works by iterating (“Iterating” means going through a table row by row) the table specified in the 1st argument, which is one-column table you just created with VALUES function. It applies the logic to each row utilizing context transition in this case.
You can also iterate the sales table to get unique customer key values, however, the rule of thumb is to iterate as little data as possible. That usually leads to better performance. Hence, I’m iterating the customer table rather than fact table.
However, it’s worth noting that there are cases where you get better performance when iterating the fact table as it won’t involve table joins. But DAX is very situational, so just remember the rule of thumb is to iterate as little data as possible.
The matrix visual below shows how much customers spent on each product color:
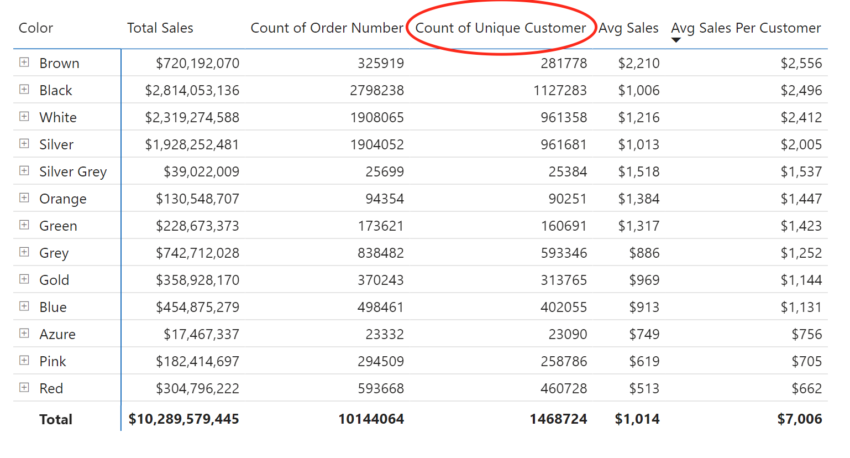
We can validate “Avg Sales” measure by dividing Total Sales by the count of order number. But what about “Average Sales Per Customer”? It’s clear if you add another measure showing unique customer count.
In the visual below, you can see it’s calculating the average amount each customer spent on each product color. You can calculate it by dividing total sales by the count of unique customers.

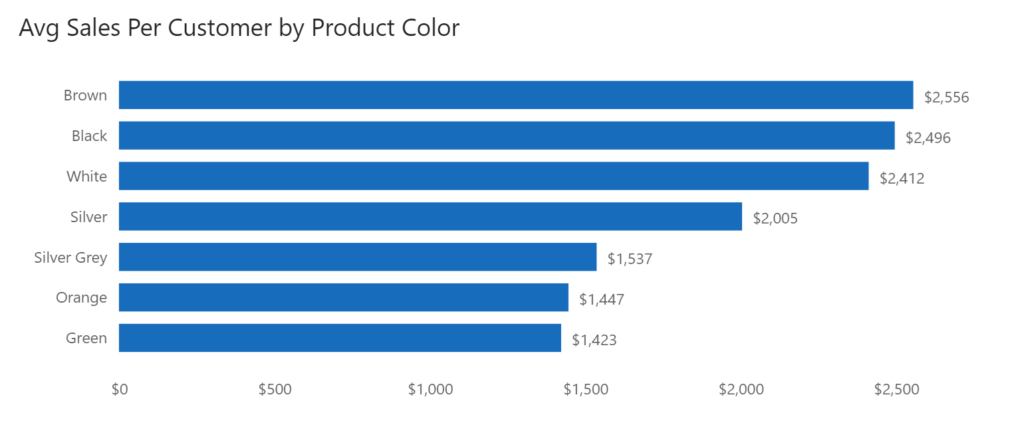
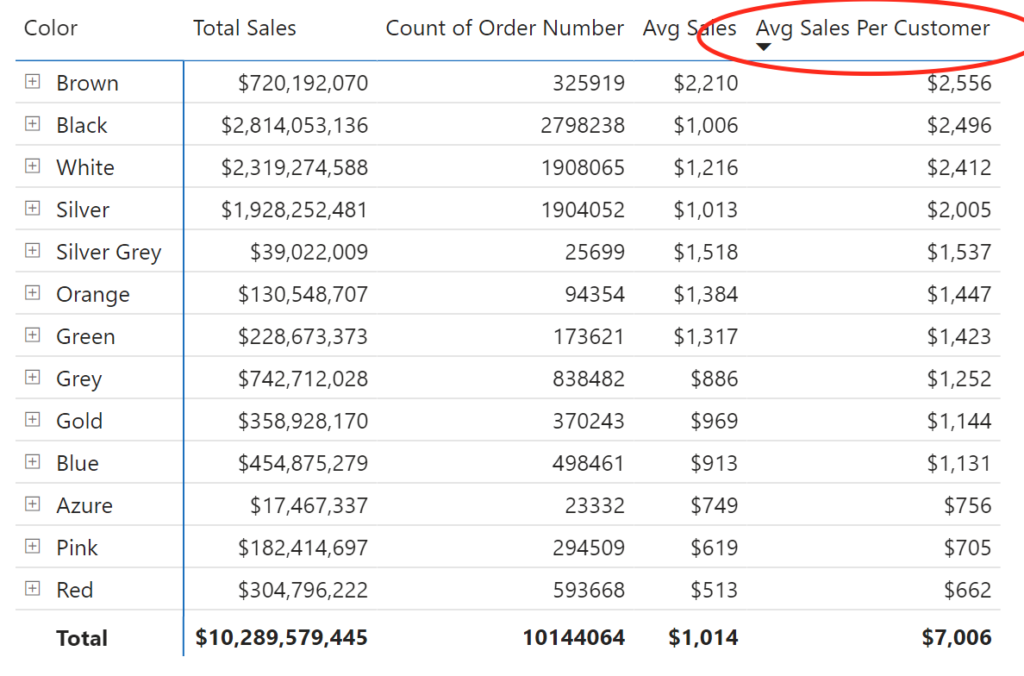
The final visual in your report would look something like this:
Conclusion
This type of calculation comes in handy for answering various questions from the business. CALCULATE function always comes into play whenever we want to take advantage of context transition and applying filters to a calculation. VALUES function can get you a unique values of a column. DAX makes it easier for us to author many types of calculations, but only if you know how to do it. The more you work on DAX problems, the better you’ll be at DAX.