MoM 2020 Week39 – Tableau
Author: Yuki
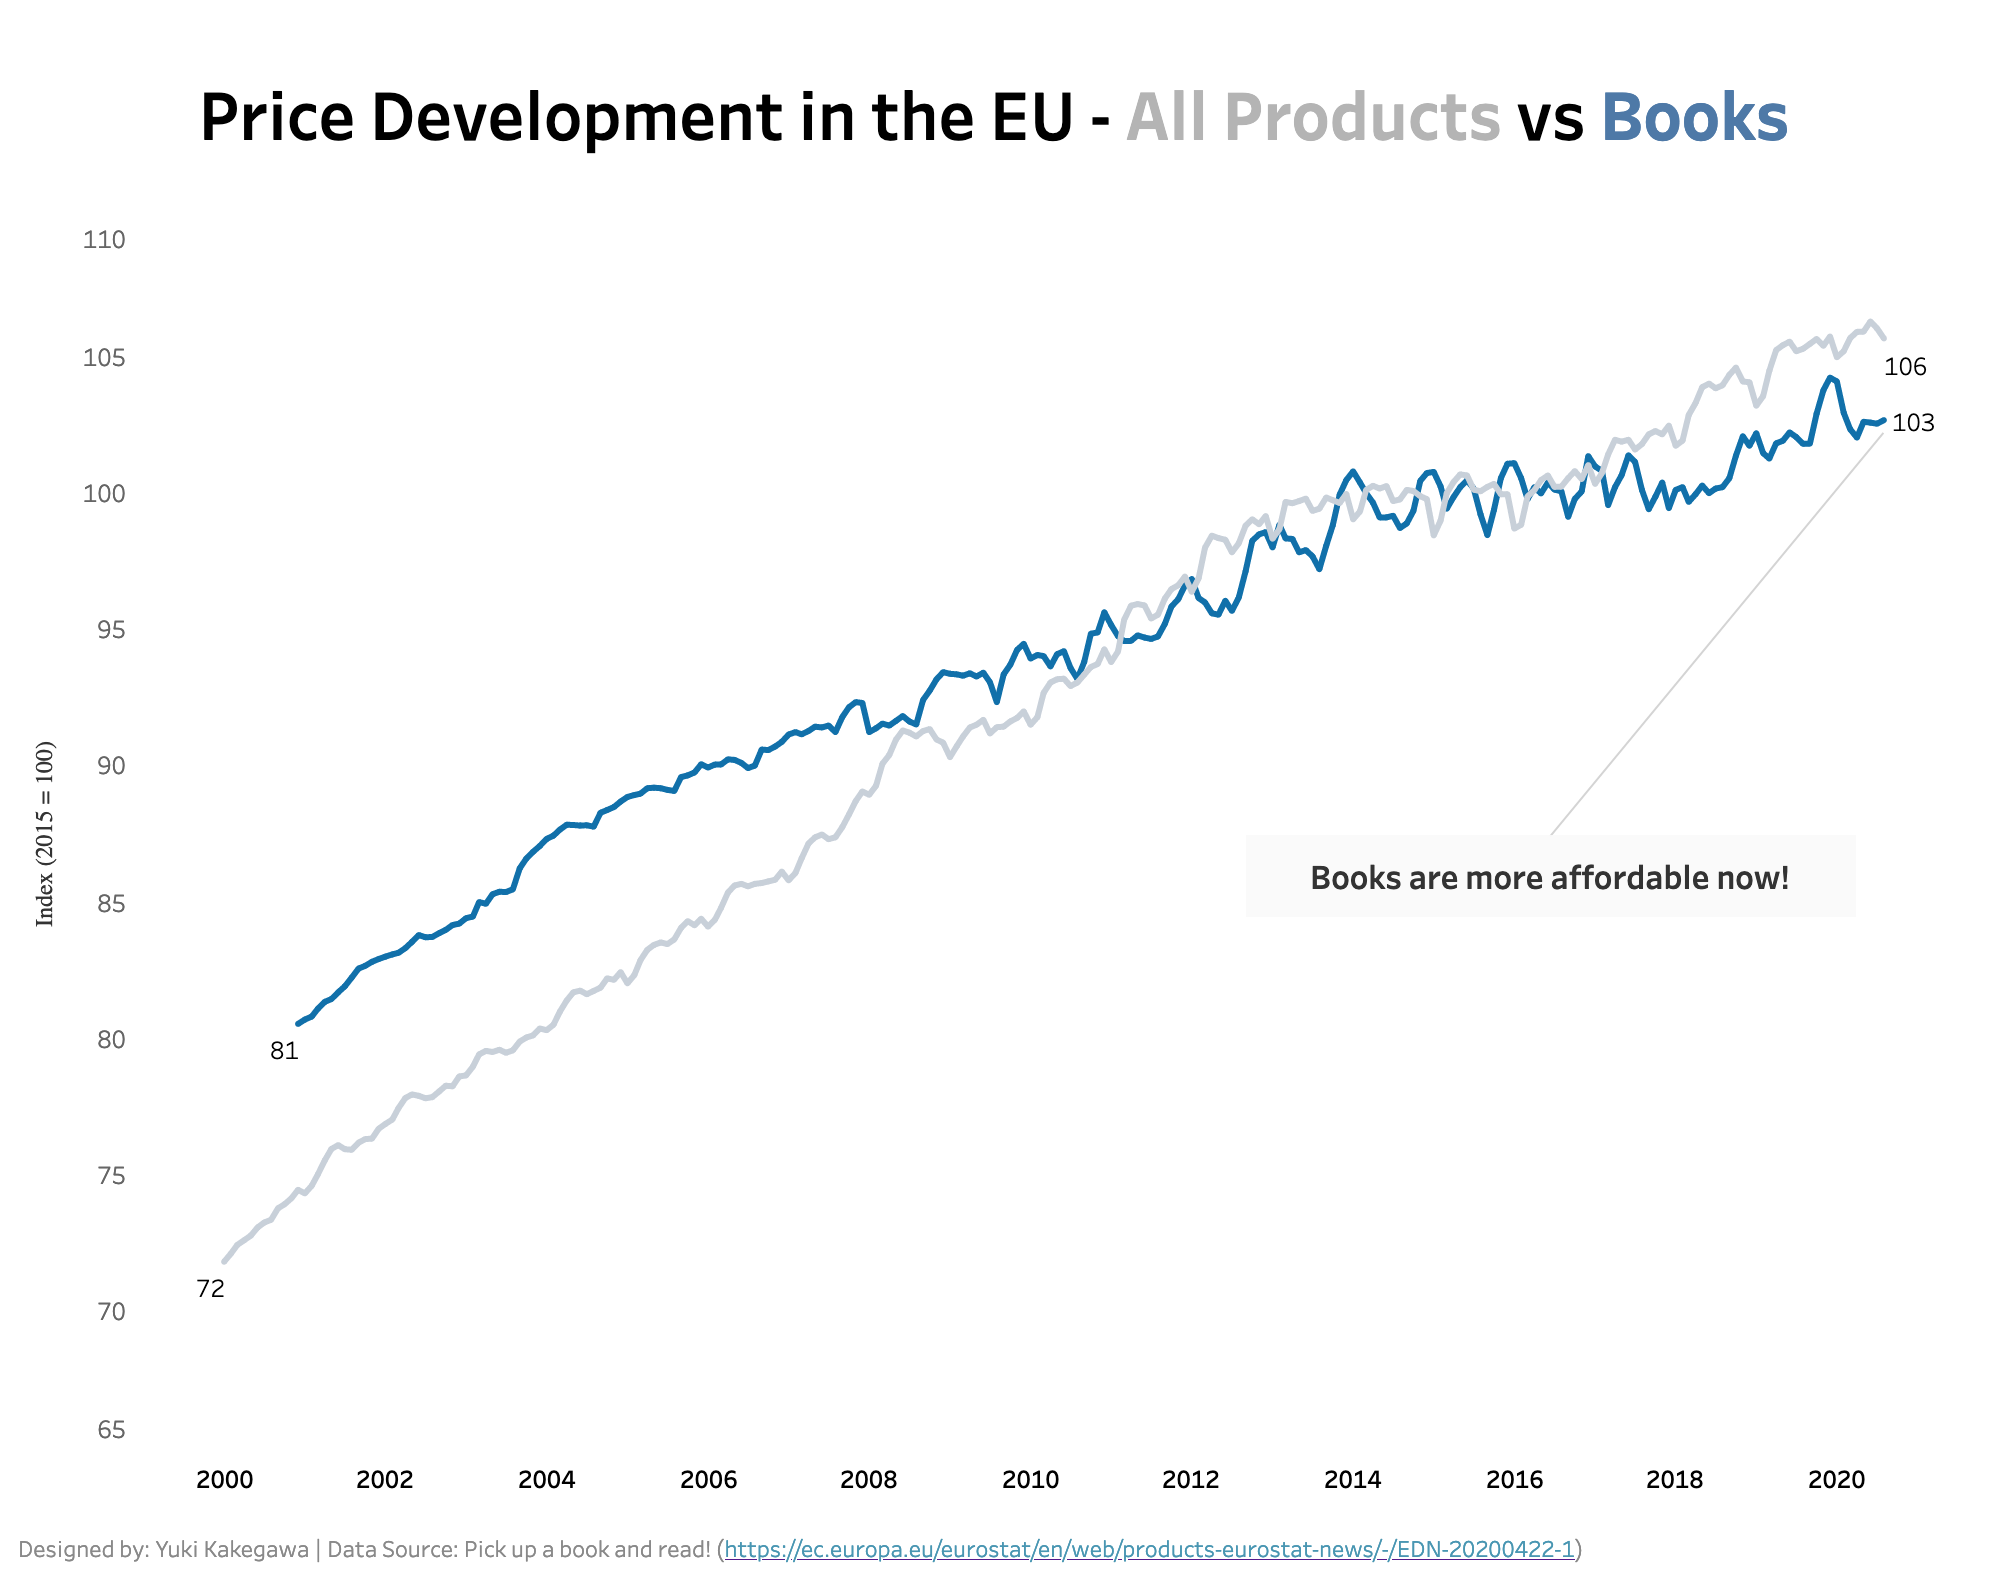
Books Are More Affordable Than Other Products in the EU
MoM 2020 Week38 – Tableau
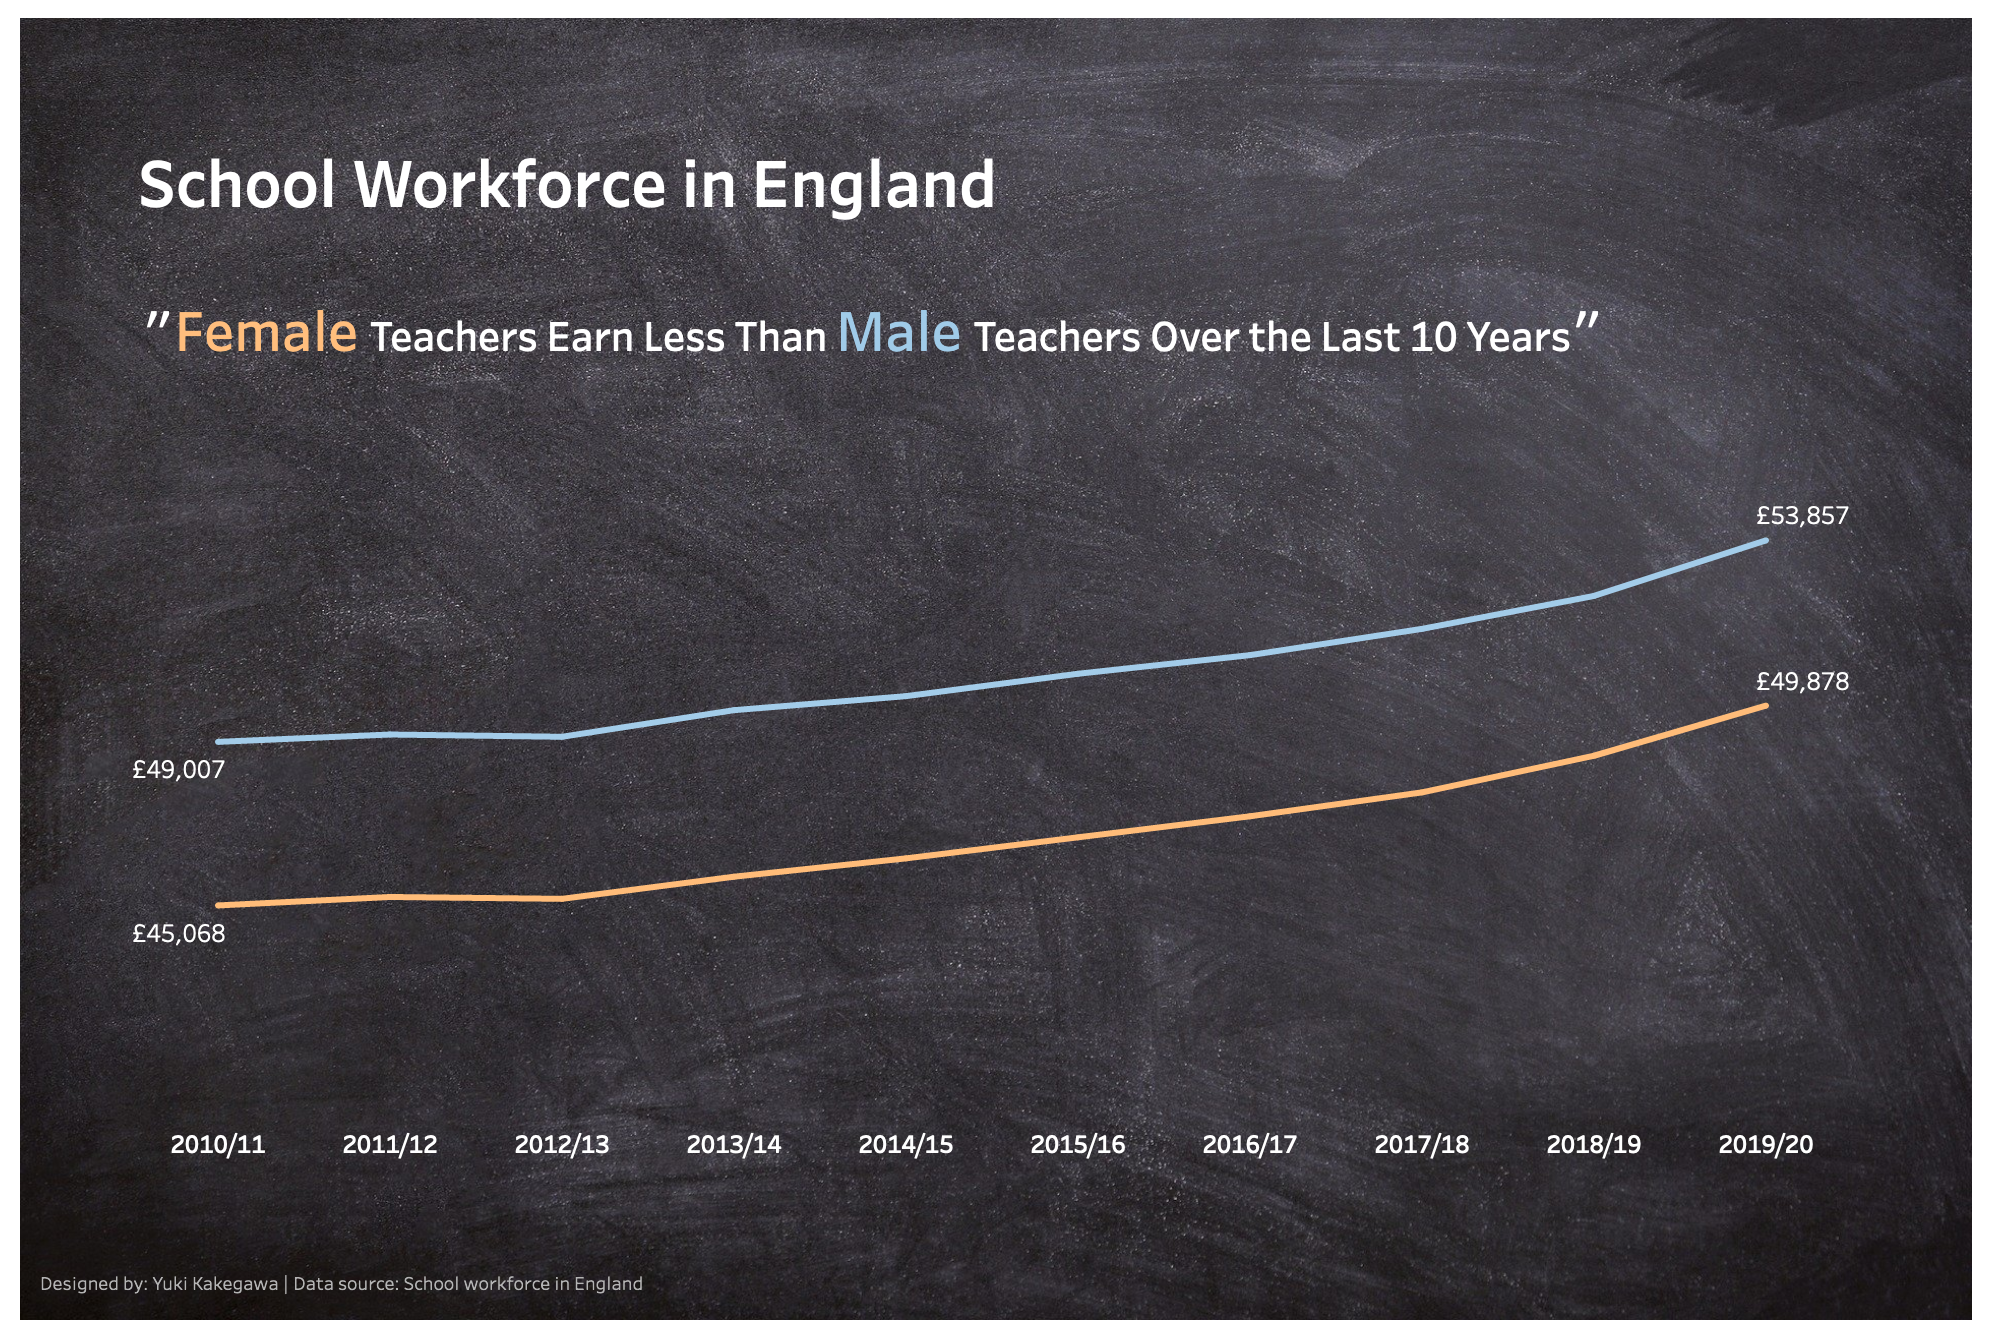
Multiple Lines to Show Difference
MoM 2020 Week37 – Tableau
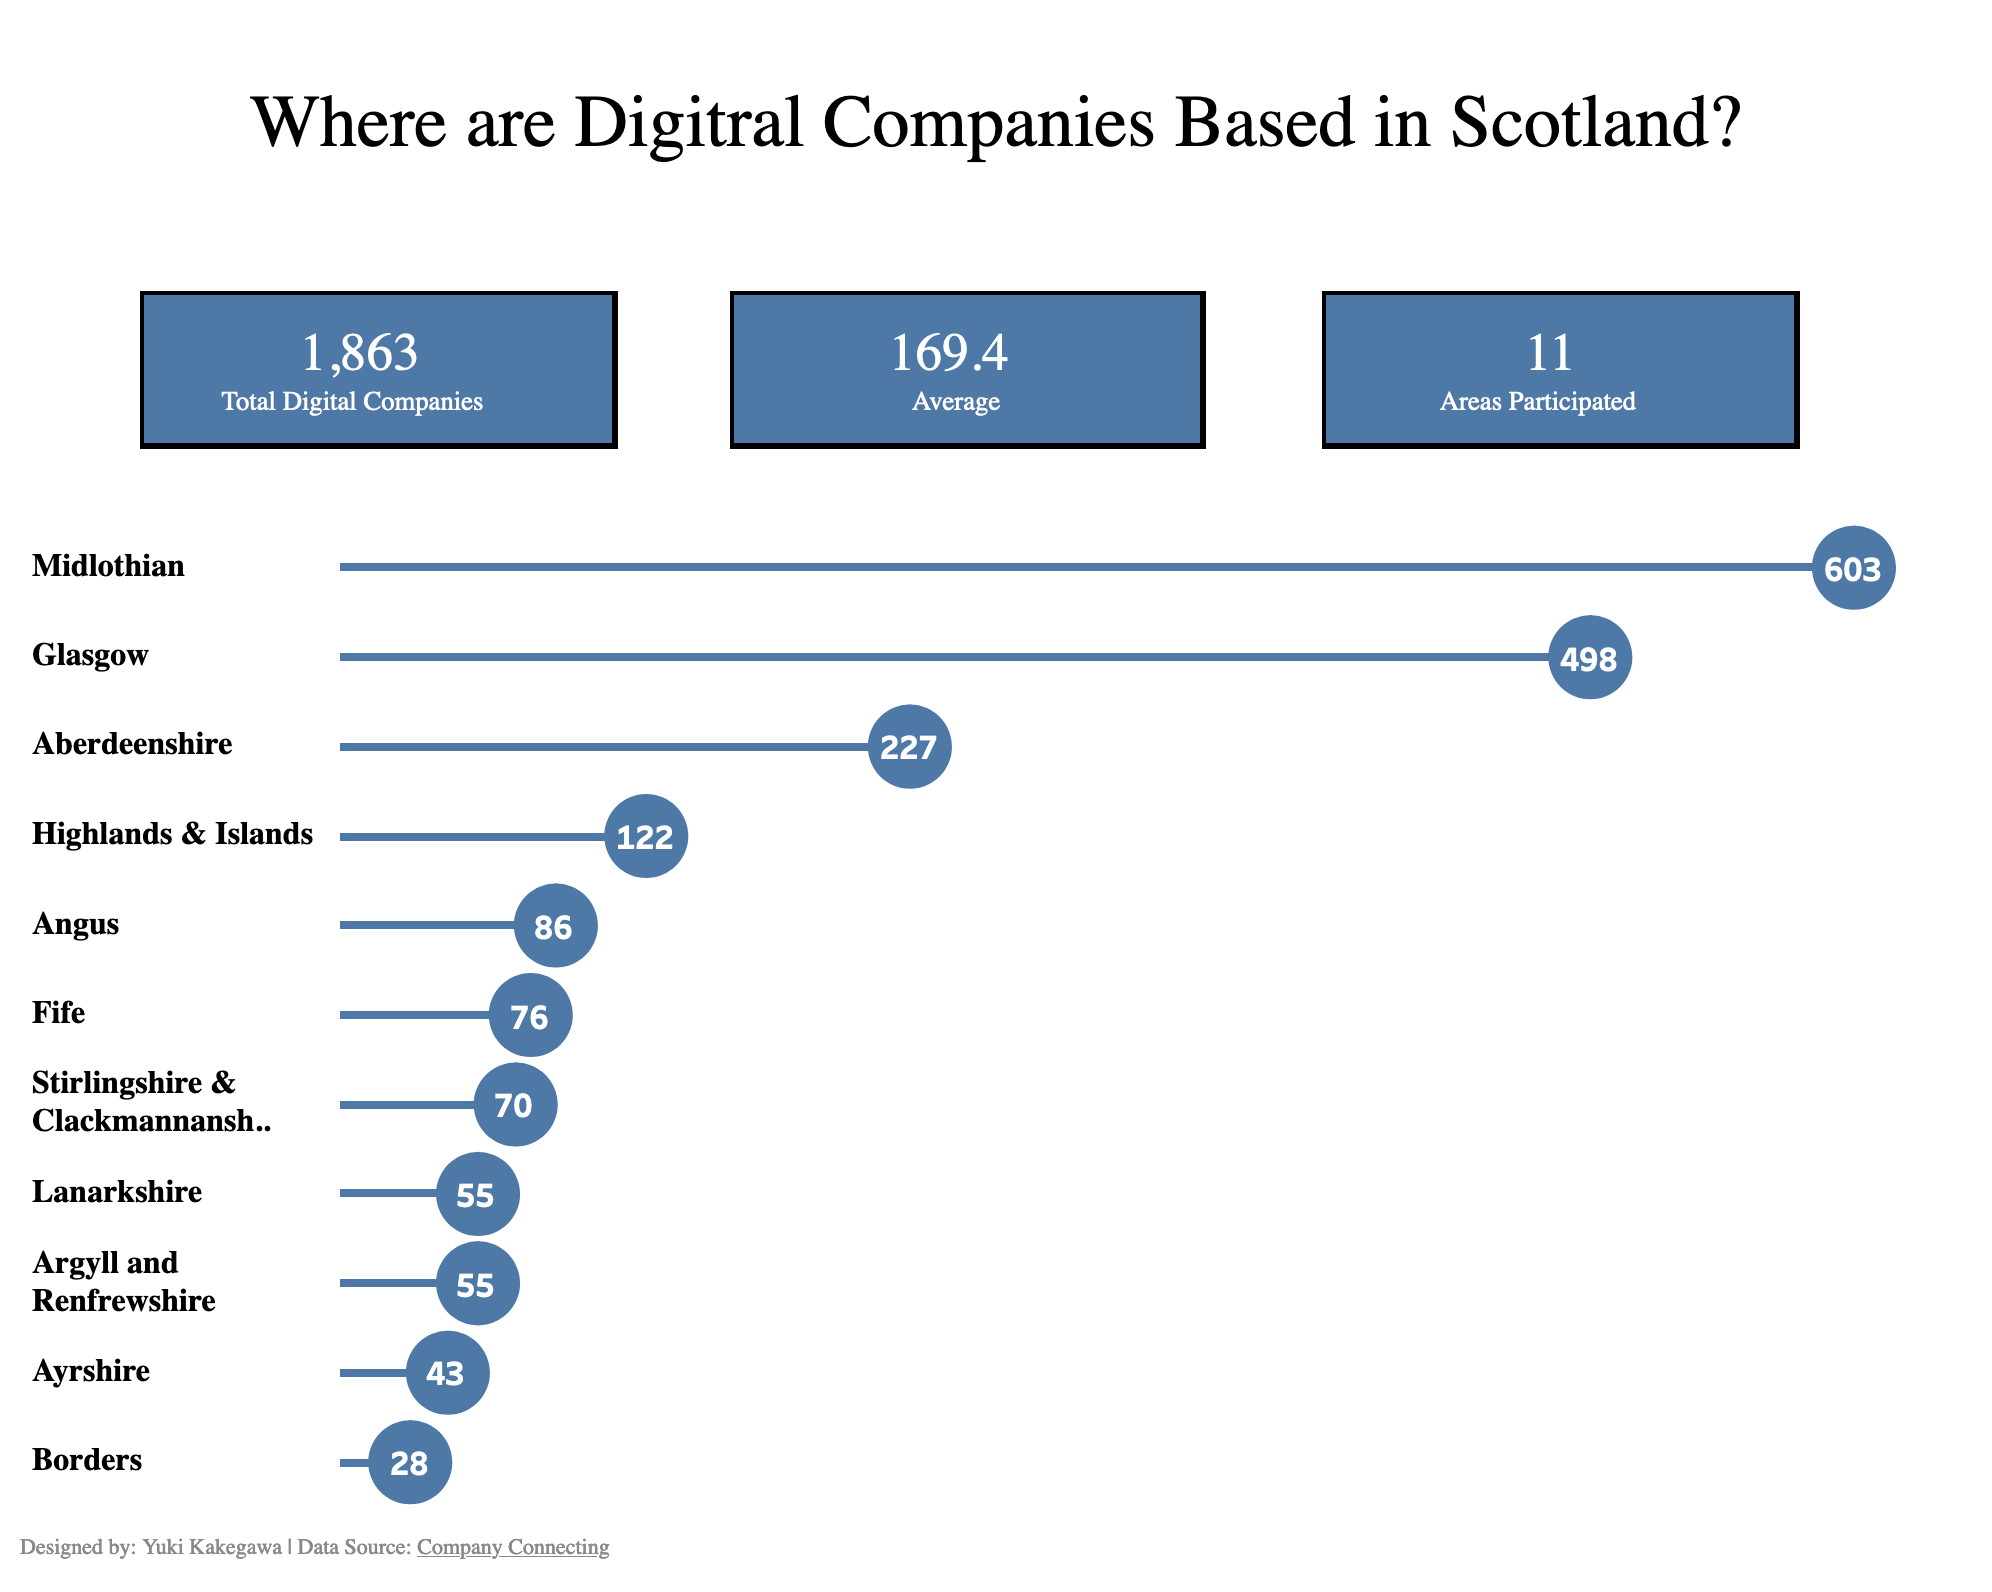
Digital Companies in Scotland
MoM 2020 Week33 – Tableau
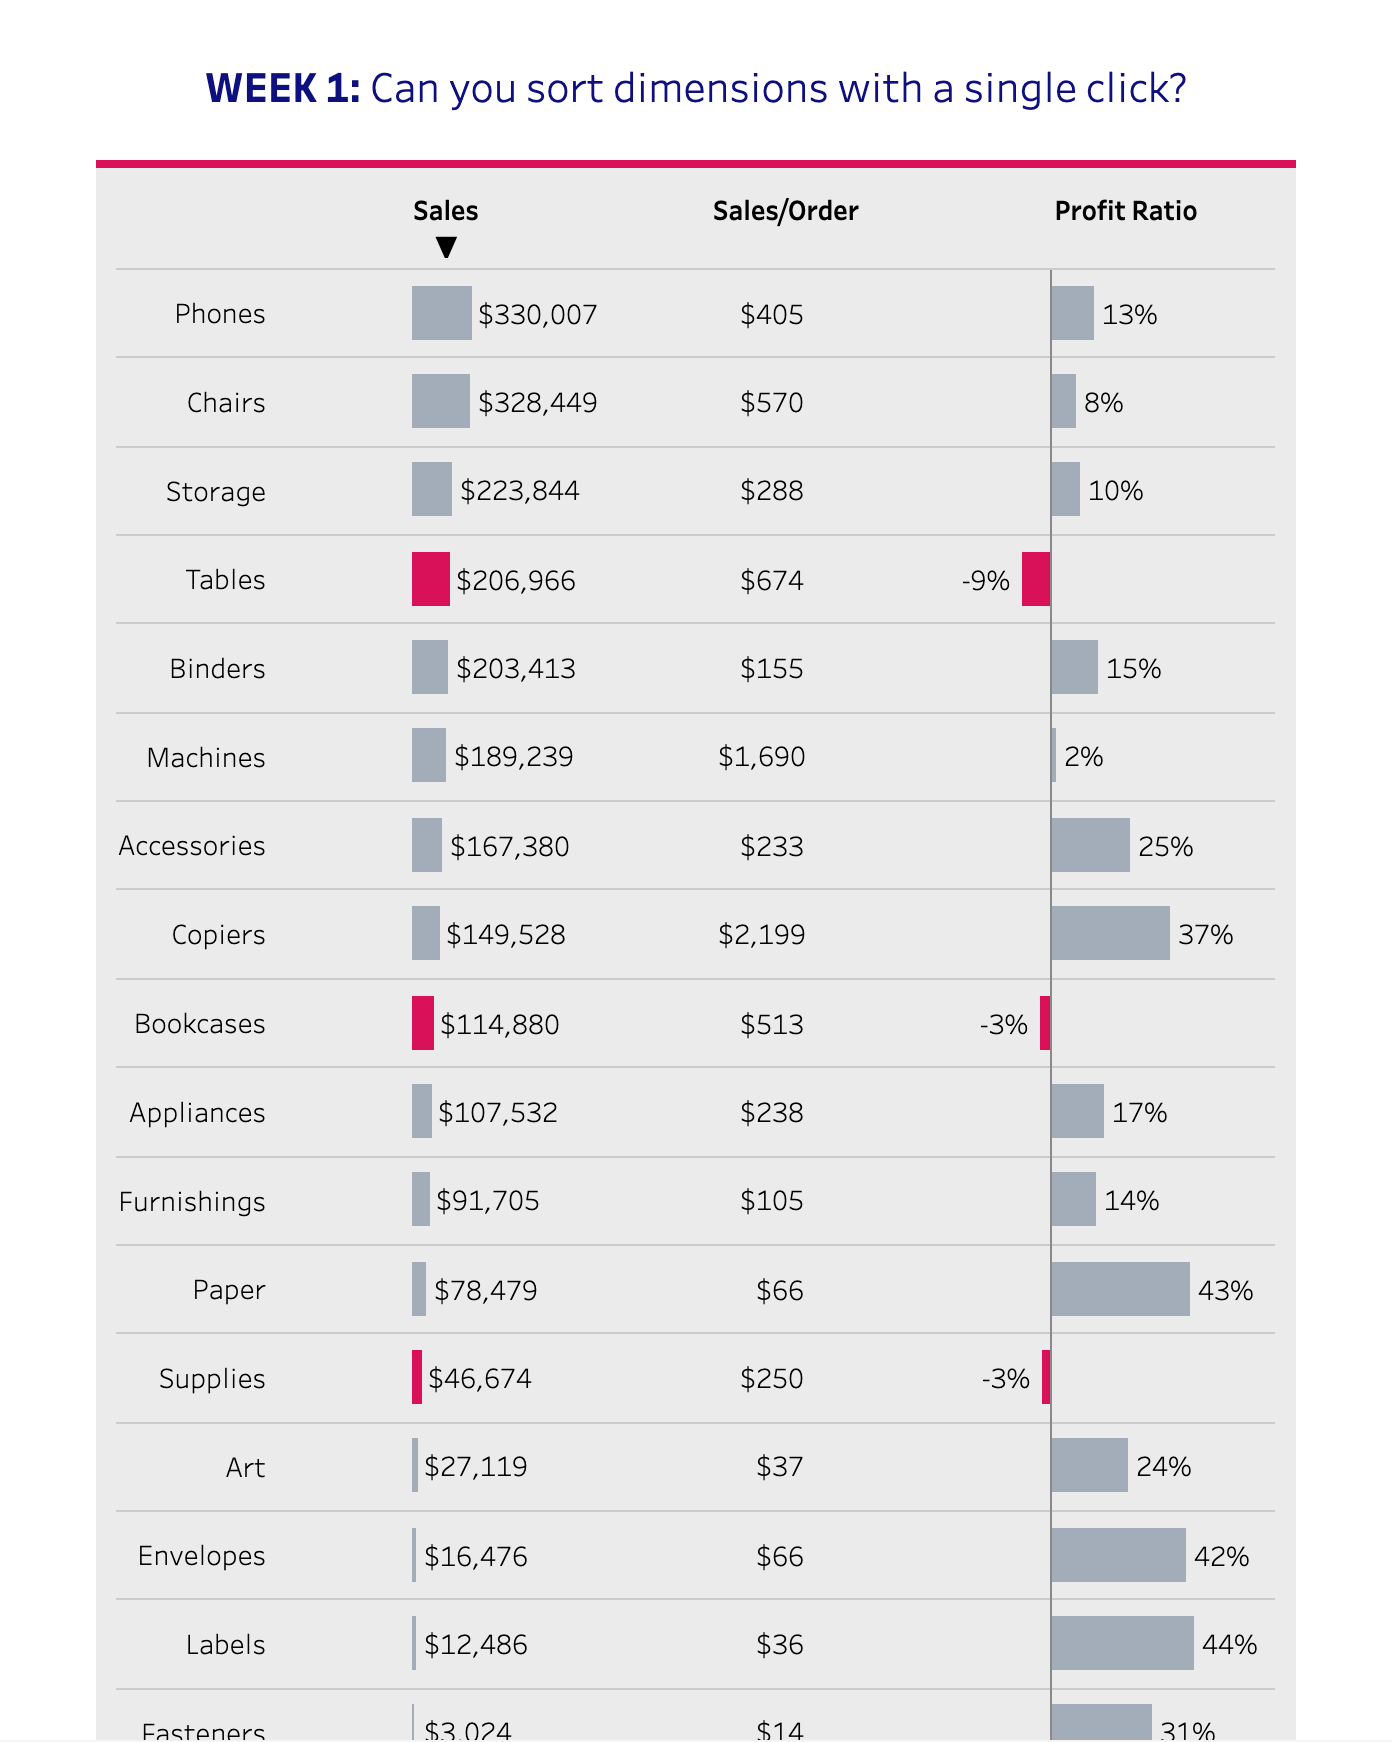
Sort Dimensions in a Single Click in Tableau
WoW 2020 Week1 – Tableau
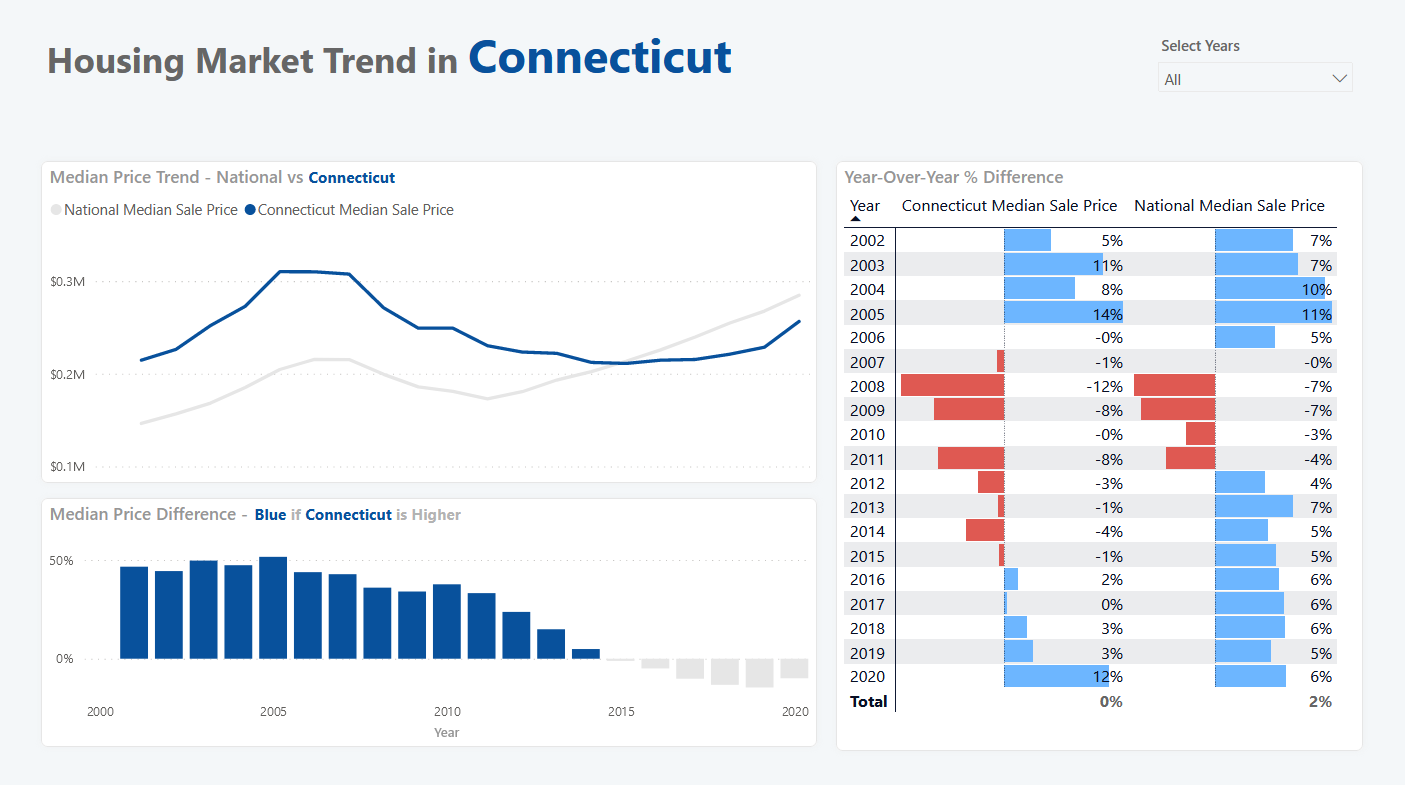
Year-Over-Year Calculation: Time Intelligence in Power BI
WoW 2021 Week21 – Power BI
What is Query Folding in Power BI
Definition of Query Folding Made Simple
Amazon is Investing in the Future…
MoM 2020 Week25 – Tableau A simple line chart showing a distinct pattern of Amazon’s revenues over time. Their profit started to increase around 2016! Interactive visualization
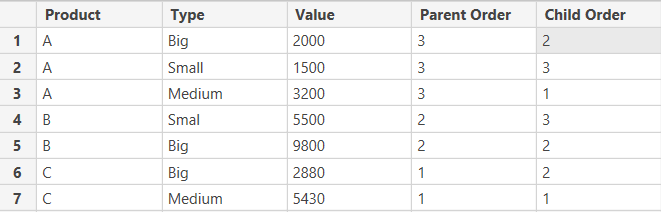
Hierarchical Sorting in Power BI
I explain how to sort values with hierarchies.
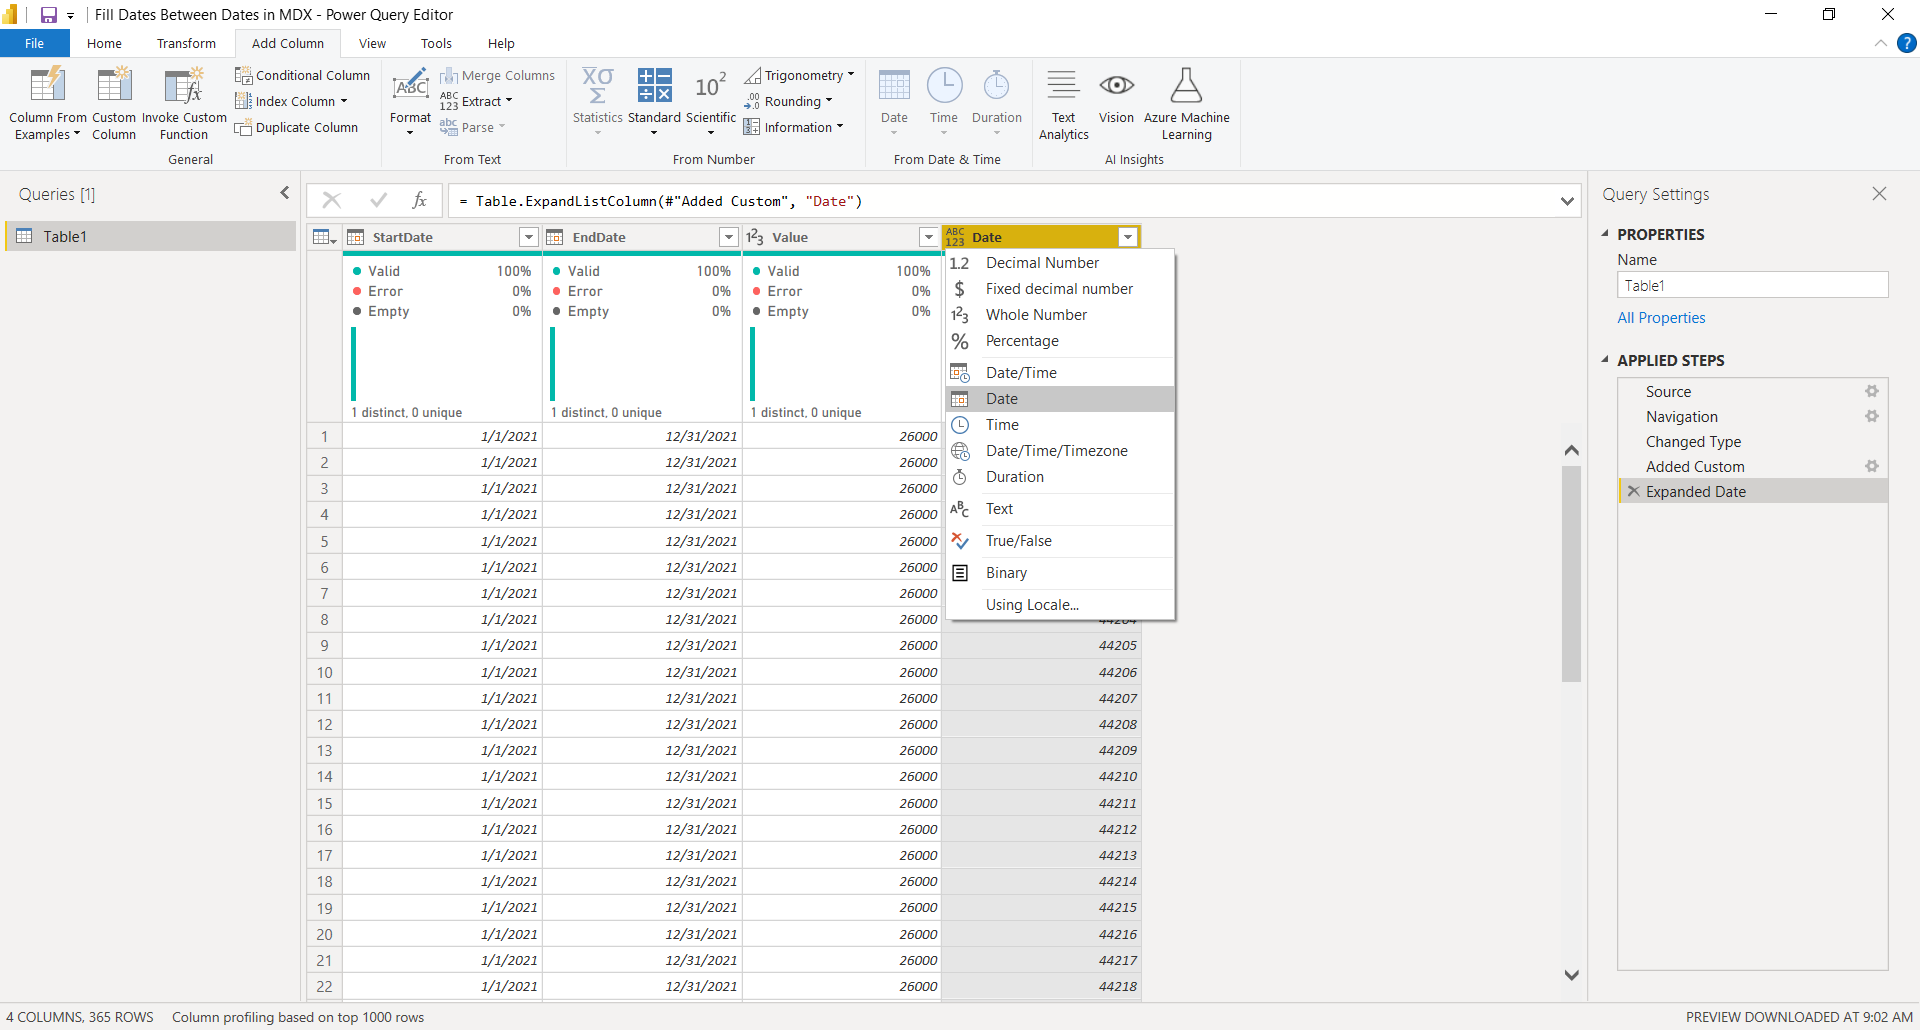
How to Fill Dates Between Start Date and End Date in Power BI (Power Query)
A step by step guide to fill dates between start date and end date